

Question
Rita Sharp, Director of Operations at the Farnsworth Museum of Industrial Arts, has gathered weekly visitor data for the past year. Rita is interested in
Rita Sharp, Director of Operations at the Farnsworth Museum of Industrial Arts, has
gathered weekly visitor data for the past year. Rita is interested in explaining why the
number of visitors (NUMV) varies from week to week. Rita has data on two independent
variables. The first is a dummy variable coded 1 for weeks when new items went on
display and coded 0 for all other weeks (NITEM). The second is a variable for the price
of an admissions ticket because part of the museum's marketing strategy is to have
weekly reduced-price admission promotions (TPRICE). The director asks you to generate
a regression equation using these data. Use the data in the Excel spreadsheet to (1)
produce a regression model, (2) interpret the parameters, and (3) access the goodness of fit of the model. In summarizing the findings, what should you tell the director?
Question 4 NUMV NITEM TPRICE 933 0 5 1240 1 5 983 0 5 1129 1 5 758 0 5 927 0 5 1247 1 5 870 0 5 1140 0 3 1231 0 2.5 1038 0 3 1184 0 5 991 0 5 1059 0 3 1397 1 5 756 0 5 1098 0 3 1330 0 2.5 1129 0 5 774 0 5 847 0 5 1206 1 3 1340 1 5 1166 1 5 816 0 5 821 0 5 919 0 5 1214 1 5 1320 0 2.5 1161 0 5 1207 0 5 1246 1 5 1006 0 5 1198 0 2.5 1331 1 5 1101 0 5 1214 0 5 1172 0 3 1137 0 5 1172 0 3 1309 1 5 1051 0 5 1009 0 5 1072 1 5 1118 0 2.5 1106 0 5 1197 0 5 1091 1 5 895 0 5 803 0 5 997 0 5 822 0 5
Step by Step Solution
There are 3 Steps involved in it
Step: 1

Get Instant Access to Expert-Tailored Solutions
See step-by-step solutions with expert insights and AI powered tools for academic success
Step: 2

Step: 3
Ace Your Homework with AI
Get the answers you need in no time with our AI-driven, step-by-step assistance
Get Started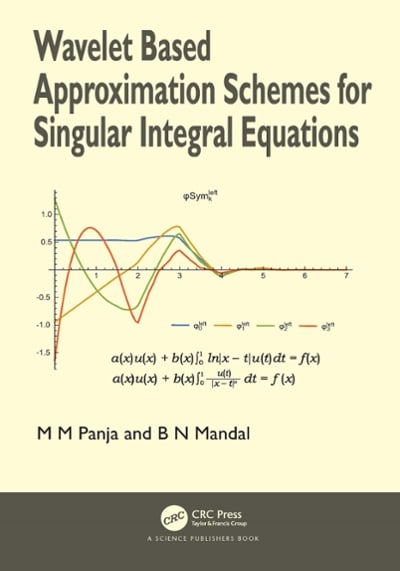
Wavelet Based Approximation Schemes For Singular Integral Equations
Authors: Madan Mohan Panja, Birendra Nath Mandal
1st Edition
0429534280, 9780429534287