

Question
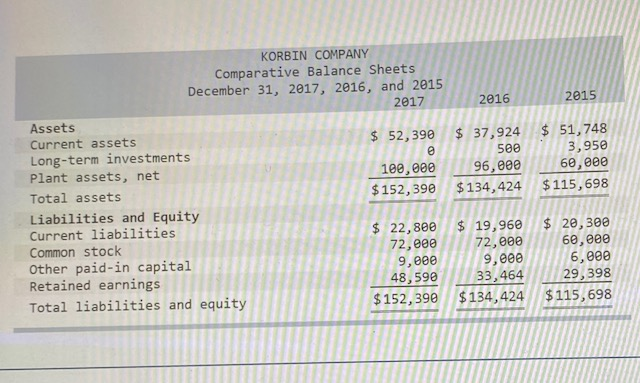
roblem 13-2A Ratios, common-size statements, and trend percents LO P1, P2, P3 [The following information applies to the questions displayed below.] Selected comparative financial statements
roblem 13-2A Ratios, common-size statements, and trend percents LO P1, P2, P3
[The following information applies to the questions displayed below.] Selected comparative financial statements of Korbin Company follow.
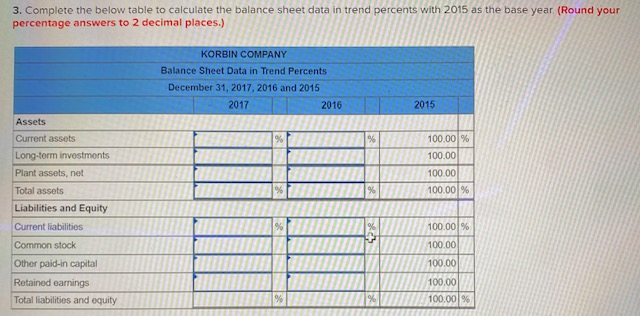
3. Complete the below table to calculate the balance sheet data in trend percents with 2015 as the base year. (Round your percentage answers to 2 decimal places.)

Step by Step Solution
There are 3 Steps involved in it
Step: 1

Get Instant Access to Expert-Tailored Solutions
See step-by-step solutions with expert insights and AI powered tools for academic success
Step: 2

Step: 3
Ace Your Homework with AI
Get the answers you need in no time with our AI-driven, step-by-step assistance
Get Started
Audit Skill Management Ref PPAP ISO 9000 And ISO 14000 Series
Authors: FULBODH CHAUDHARY
1st Edition
1520470843, 978-1520470849