

Answered step by step
Verified Expert Solution
Question
1 Approved Answer
Rough Matlab outline code 6. 3-D data visualization. Download 'aperture_ data.txt' text file from Canvas. This file contains the CT data for a given core
Rough Matlab outline code
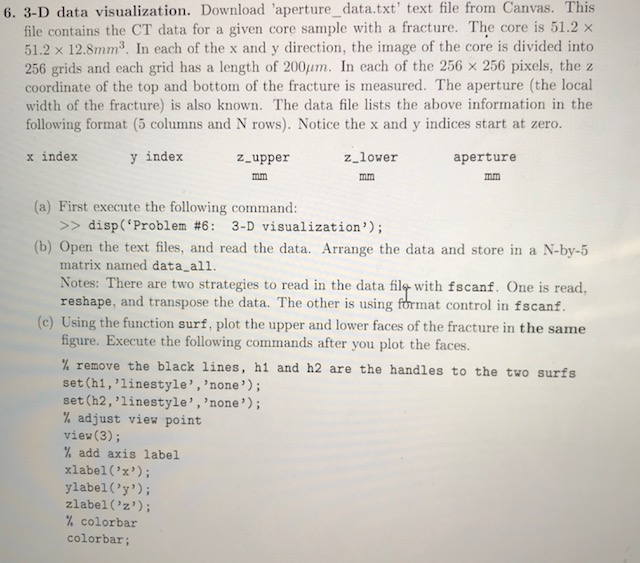
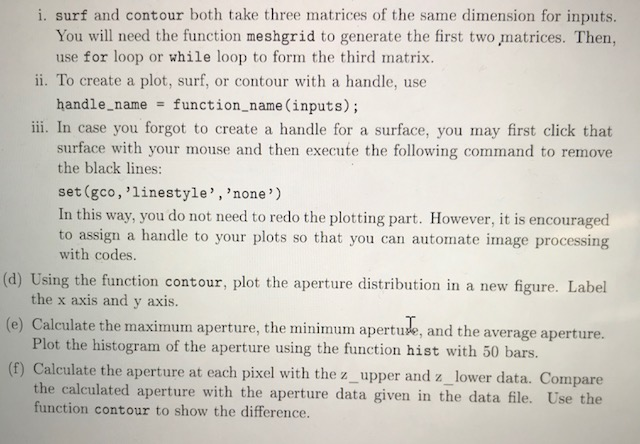
6. 3-D data visualization. Download 'aperture_ data.txt' text file from Canvas. This file contains the CT data for a given core sample with a fracture. The core is 51.2 x 51.2 128mm3. In each of the x and y direction, the image of the core is divided into 256 grids and each grid has a length of 200". In each of the 256 256 pixels, the z coordinate of the top and bottom of the fracture is measured. The aperture (the local width of the fracture) is also known. The data file lists the above information in the following format (5 columns and N rows). Notice the x and y indices start at zero. x index y index z.upper z_lower aperture mn (a) First execute the following command: >> disp ('Problem #6: 3-D visualization'); (b) Open the text files, and read the data. Arrange the data and store in a N-by-5 matrix named data all. Notes: There are two strategies to read in the data file with fscanf. One is read, reshape, and transpose the data. The other is using format control in fscanf (c) Using the function surf, plot the upper and lower faces of the fracture in the same figure. Execute the following commands after you plot the faces. % remove the black lines, h1 and h2 are the handles to the two surfs set (h1,'linestyle', 'none); set (h2, 'linestyle', 'none'); % adjust view point view(3); % add axis label xlabel('x'); ylabel ('y'); zlabel ('z'); % colorbar colorbar; 6. 3-D data visualization. Download 'aperture_ data.txt' text file from Canvas. This file contains the CT data for a given core sample with a fracture. The core is 51.2 x 51.2 128mm3. In each of the x and y direction, the image of the core is divided into 256 grids and each grid has a length of 200". In each of the 256 256 pixels, the z coordinate of the top and bottom of the fracture is measured. The aperture (the local width of the fracture) is also known. The data file lists the above information in the following format (5 columns and N rows). Notice the x and y indices start at zero. x index y index z.upper z_lower aperture mn (a) First execute the following command: >> disp ('Problem #6: 3-D visualization'); (b) Open the text files, and read the data. Arrange the data and store in a N-by-5 matrix named data all. Notes: There are two strategies to read in the data file with fscanf. One is read, reshape, and transpose the data. The other is using format control in fscanf (c) Using the function surf, plot the upper and lower faces of the fracture in the same figure. Execute the following commands after you plot the faces. % remove the black lines, h1 and h2 are the handles to the two surfs set (h1,'linestyle', 'none); set (h2, 'linestyle', 'none'); % adjust view point view(3); % add axis label xlabel('x'); ylabel ('y'); zlabel ('z'); % colorbar colorbar
Step by Step Solution
There are 3 Steps involved in it
Step: 1

Get Instant Access to Expert-Tailored Solutions
See step-by-step solutions with expert insights and AI powered tools for academic success
Step: 2

Step: 3
Ace Your Homework with AI
Get the answers you need in no time with our AI-driven, step-by-step assistance
Get Started
Transactions On Large Scale Data And Knowledge Centered Systems Iv Special Issue On Database Systems For Biomedical Applications Lncs 6990
Authors: Abdelkader Hameurlain ,Josef Kung ,Roland Wagner ,Christian Bohm ,Johann Eder ,Claudia Plant
2011th Edition
3642237398, 978-3642237393