Answered step by step
Verified Expert Solution
Question
1 Approved Answer
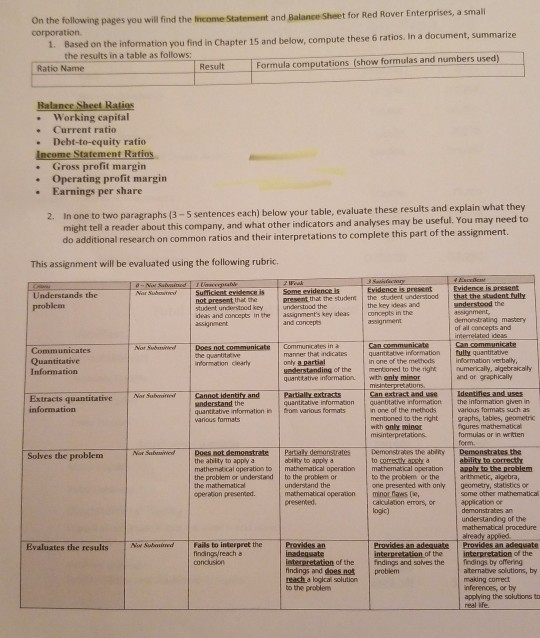
Rover Enterprises, a smali On the following pages you will find the Income Statement a corporation nd Balance Sheet for Red Based on the information


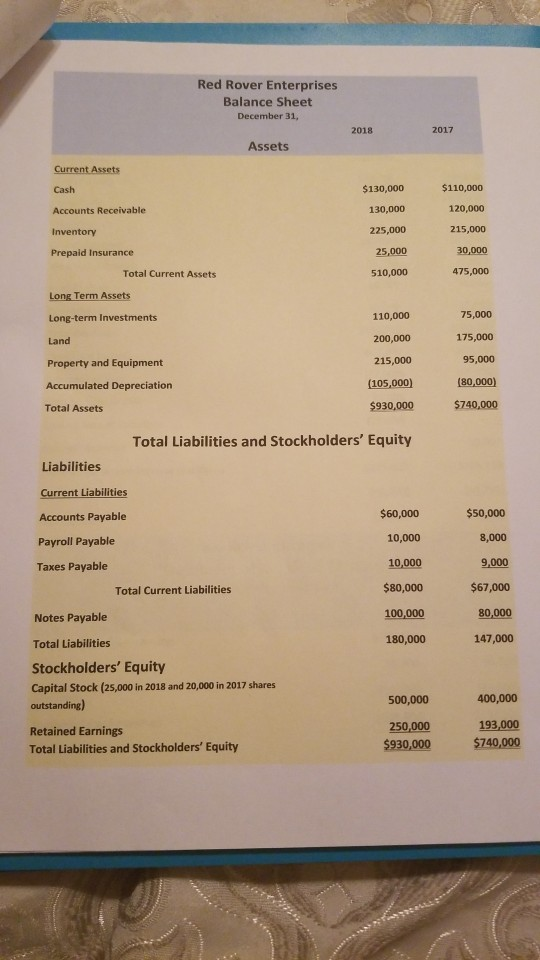
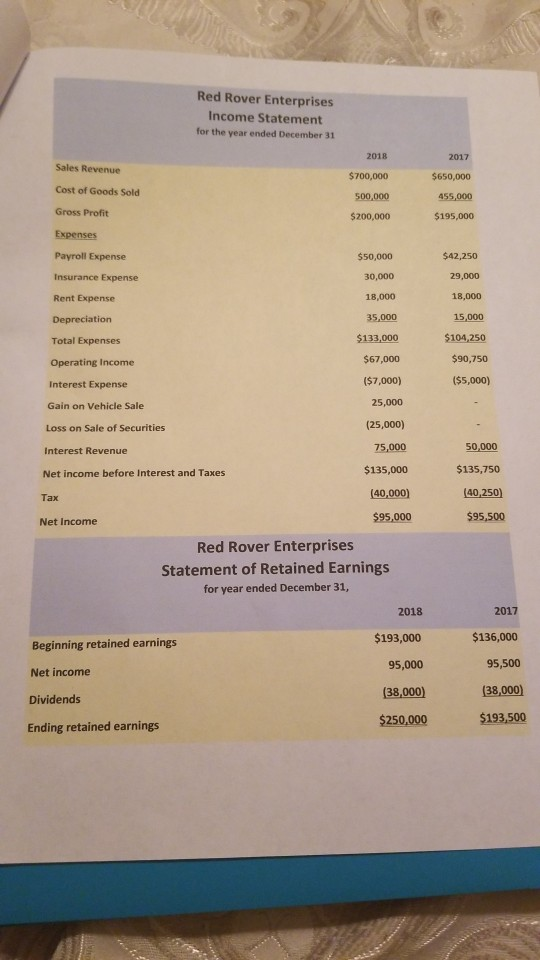
Rover Enterprises, a smali On the following pages you will find the Income Statement a corporation nd Balance Sheet for Red Based on the information you find in Chapter 15 and below, compute these 6 ratios. in a document, summarize the results in a table as follows Ratio Name ResultFormula computations (show formulas and numbers used) Balance Sheet Ratios . Working capital . Current ratio . Debt-to-equity ratio Income Statement Ratios . Gross profit margin Operating profit margin Earnings per share In one to two might tell a reader do additional research on common ratios and their interpretations to complete this part of the assignment. paragraphs (3-5 sentences each) below your table, evaluate these results and explain what they about this company, and what other indicators and analyses may be useful. You may need to 2. This assignment will be evaluated using the following rubric. ar Suhowted Suficient cvisdence is Some evidence is Evidence is present Evidence is present Understands the problem prevent that the the key deas and assignn demonstraring mastery of all concepts and deas and concepts in the assignment's key ideas concepts in the and once rrelated icate quantkative information fully quantitative in one of the methodsinformation verbally Quantitative only partial understanding of the mentioned to the right numerically, algebraically quanttative information wth gnly mingr nd or grachicaly Extracts quantitative Nor Sathmine quantitative information quentitatve information the information gven in understand the quanttative information in trom various formats n one of the methods mentioned to the right graphs, tables, geoemetic wkh only miner misinterpretations arious for formulas or in wrtten form. ability to correcthy arthmetc, algebra, Nor Sabesiiel Does not demonstratePart demonstrates Demonstrates the abiny Demonstrates the Solves the problem the ablity to apply a mathematical operation the problem or understand the mathematical operation presented. bity to apply a to mathematical operation mathematical operation apply to the problem to the problem or to the problem or the one presented with only geometry, statistics or mathematical operation presented minor naws (, caiculation errors, or ogic) appication cr understandng of the Swbouimed Fails to interpret the Provides an inadegwate interpretation of the findings and soves the fndings by cffering findings and does not probiem Evaluates the results findngs/reach a interpretation of the interpretation of the aternatbve solutions, by making correct nferences, or by applying the solutions to to the problem real ife Red Rover Enterprises Balance Sheet December 31, 2018 2017 Assets Current Assets Cash Accounts Receivable $130,000 130,000 225,000 $110,000 120,000 215,000 30,000 475,000 Prepaid Insurance Total Current Assets 510,000 Term Long-term Investments Land Property and Equipment Accumulated Depreciation Total Assets 110,000 200,000 215,000 105,000) 180,000) $930,000 75,000 175,000 95,000 $740,000 Total Liabilities and Stockholders' Equity Liabilities Current Liabilities Accounts Payable Payroll Payable Taxes Payable $60,000 10,000 10,000 $80,000 100,000 180,000 $50,000 8,000 9,000 $67,000 80,000 147,000 Total Current Liabilities Notes Payable Total Liabilities Stockholders' Equity Capital Stock (25,000 in 2018 and 20,000 in 2017 shares outstanding) 400,000 193,000 $930,000$740,000 500,000 250,000 Retained Earnings Total Liabilities and Stockholders' Equity Red Rover Enterprises Income Statement for the year ended December 31 Sales Revenue Cost of Goods Sold Gross Profit 2018 $700,000 500,000 $200,000 2017 $650,000 455,000 195,000 Payroll Expense $50,000 $42,250 Insurance Expense Rent Expense Depreciation Total Expenses Operating Income Interest Expense Gain on Vehicle Sale 30,000 18,000 35,000 $133,000 $67,000 ($7,000) 29,000 15,000 104,250 $90,750 ($5,000) 25,000 (25,000) 75,000 $135,000 (40,000) $95,000 Loss on Sale of Securities Interest Revenue Net income before Interest and Taxes Tax Net Income 50,000 $135,750 (40,250 $95,500 Red Rover Enterprises Statement of Retained Earnings for year ended December 31, Beginning retained earnings Net income Dividends Ending retained earnings 2018 $193,000 95,000 2017 $136,000 95,500 38,000) $193,500 $250,000
Step by Step Solution
There are 3 Steps involved in it
Step: 1

Get Instant Access to Expert-Tailored Solutions
See step-by-step solutions with expert insights and AI powered tools for academic success
Step: 2

Step: 3

Ace Your Homework with AI
Get the answers you need in no time with our AI-driven, step-by-step assistance
Get Started


