

Question
R-PRogramming Language Data Set 1 : AirQualitySanFranciscoData.csv Year ExceedStateLevelDays1-hr ExceedStateLevelDays8-hr ExceedNationalLevelDays8-hr MaxConcentration1-hr MaxConcentration8-hr 2015 0 0 0 0.044 0.042 2014 3 10 5 0.097 0.081
R-PRogramming Language
Data Set 1 : AirQualitySanFranciscoData.csv
| Year | ExceedStateLevelDays1-hr | ExceedStateLevelDays8-hr | ExceedNationalLevelDays8-hr | MaxConcentration1-hr | MaxConcentration8-hr | |
| 2015 | 0 | 0 | 0 | 0.044 | 0.042 | |
| 2014 | 3 | 10 | 5 | 0.097 | 0.081 | |
| 2013 | 3 | 3 | 3 | 0.096 | 0.08 | |
| 2012 | 3 | 8 | 4 | 0.102 | 0.09 | |
| 2011 | 5 | 10 | 4 | 0.115 | 0.085 | |
| 2010 | 8 | 11 | 9 | 0.15 | 0.098 | |
| 2009 | 11 | 13 | 8 | 0.113 | 0.095 | |
| 2008 | 9 | 20 | 12 | 0.141 | 0.111 | |
| 2007 | 4 | 9 | 2 | 0.12 | 0.091 | |
| 2006 | 18 | 22 | 17 | 0.127 | 0.106 | |
| 2005 | 9 | 9 | 5 | 0.12 | 0.09 | |
| 2004 | 7 | 13 | 7 | 0.113 | 0.085 | |
| 2003 | 19 | 20 | 12 | 0.128 | 0.101 | |
| 2002 | 16 | 19 | 15 | 0.16 | 0.106 | |
| 2001 | 15 | 21 | 13 | 0.134 | 0.102 | |
| 2000 | 12 | 17 | 9 | 0.152 | 0.115 | |
| 1999 | 20 | 28 | 18 | 0.156 | 0.123 | |
| 1998 | 29 | 29 | 24 | 0.147 | 0.111 | |
| 1997 | 8 | 10 | 5 | 0.114 | 0.085 | |
| 1996 | 34 | 37 | 25 | 0.138 | 0.113 | |
Data Set 2: AirQualitySanDiegoData.csv
| Year | ExceedStateLevelDays1-hr | ExceedStateLevelDays8-hr | ExceedNationalLevelDays8-hr | MaxConcentration1-hr | MaxConcentration8-hr | |
| 2015 | 0 | 0 | 0 | 0.081 | 0.065 | |
| 2014 | 3 | 36 | 12 | 0.1 | 0.088 | |
| 2013 | 2 | 28 | 7 | 0.095 | 0.083 | |
| 2012 | 2 | 25 | 10 | 0.101 | 0.084 | |
| 2011 | 5 | 33 | 10 | 0.114 | 0.093 | |
| 2010 | 7 | 21 | 14 | 0.107 | 0.088 | |
| 2009 | 8 | 47 | 24 | 0.119 | 0.098 | |
| 2008 | 18 | 69 | 35 | 0.139 | 0.11 | |
| 2007 | 21 | 50 | 27 | 0.134 | 0.092 | |
| 2006 | 23 | 68 | 38 | 0.121 | 0.1 | |
| 2005 | 16 | 51 | 24 | 0.113 | 0.09 | |
| 2004 | 12 | 43 | 23 | 0.129 | 0.096 | |
| 2003 | 24 | 59 | 38 | 0.125 | 0.104 | |
| 2002 | 15 | 56 | 31 | 0.121 | 0.1 | |
| 2001 | 29 | 64 | 43 | 0.141 | 0.117 | |
| 2000 | 24 | 75 | 46 | 0.124 | 0.106 | |
| 1999 | 27 | 74 | 44 | 0.124 | 0.1 | |
| 1998 | 54 | 88 | 58 | 0.164 | 0.141 | |
| 1997 | 43 | 73 | 43 | 0.136 | 0.112 | |
| 1996 | 51 | 89 | 64 | 0.138 | 0.118 | |
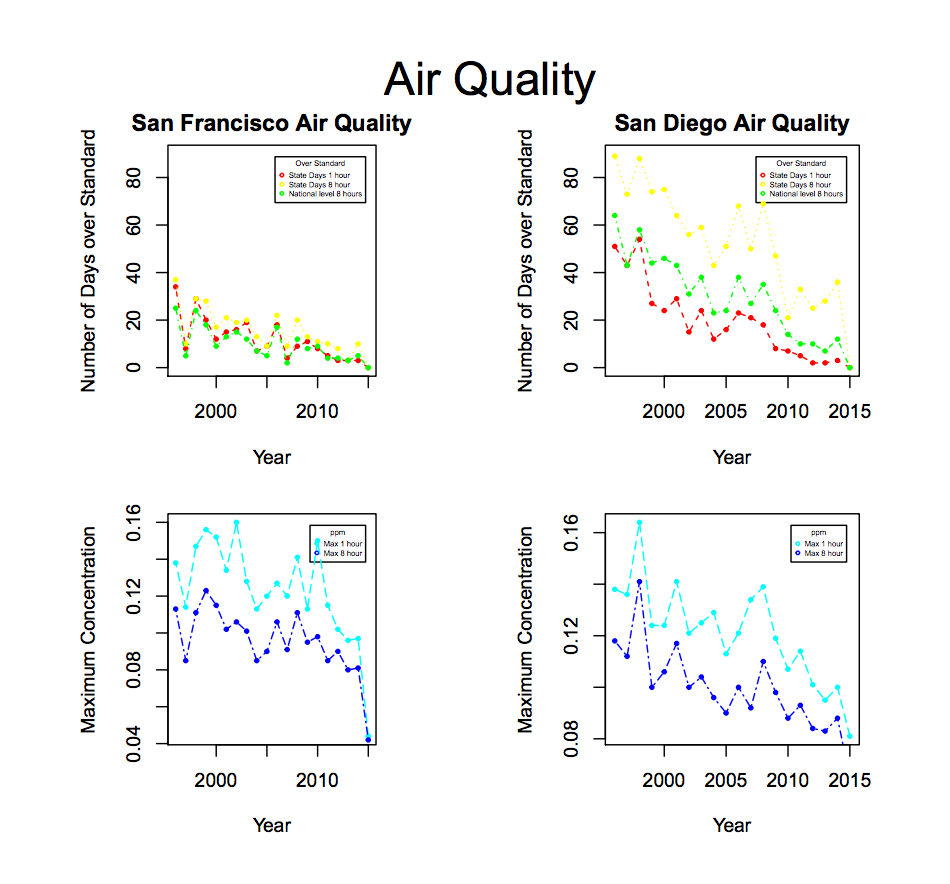
Investigate the air quality of two areas in California. Use the base plotting functions from the graphics package. Show the code you used to generate the graphs. Use the data in AirQualitySanFranciscoData.csv and in AirQualitySanDiegoData.csv. Create four graphs with the year on the horizontal axis. Two of the graphs have number of days ppm exceeded the standard on the vertical axis. Two of the graphs have maximum concentration on the vertical axis. Notice the spacing between the columns of graphs. Make an exact replica of the graph shown below:
Step by Step Solution
There are 3 Steps involved in it
Step: 1

Get Instant Access to Expert-Tailored Solutions
See step-by-step solutions with expert insights and AI powered tools for academic success
Step: 2

Step: 3
Ace Your Homework with AI
Get the answers you need in no time with our AI-driven, step-by-step assistance
Get Started
Database Administrator Limited Edition
Authors: Martif Way
1st Edition
B0CGG89N8Z