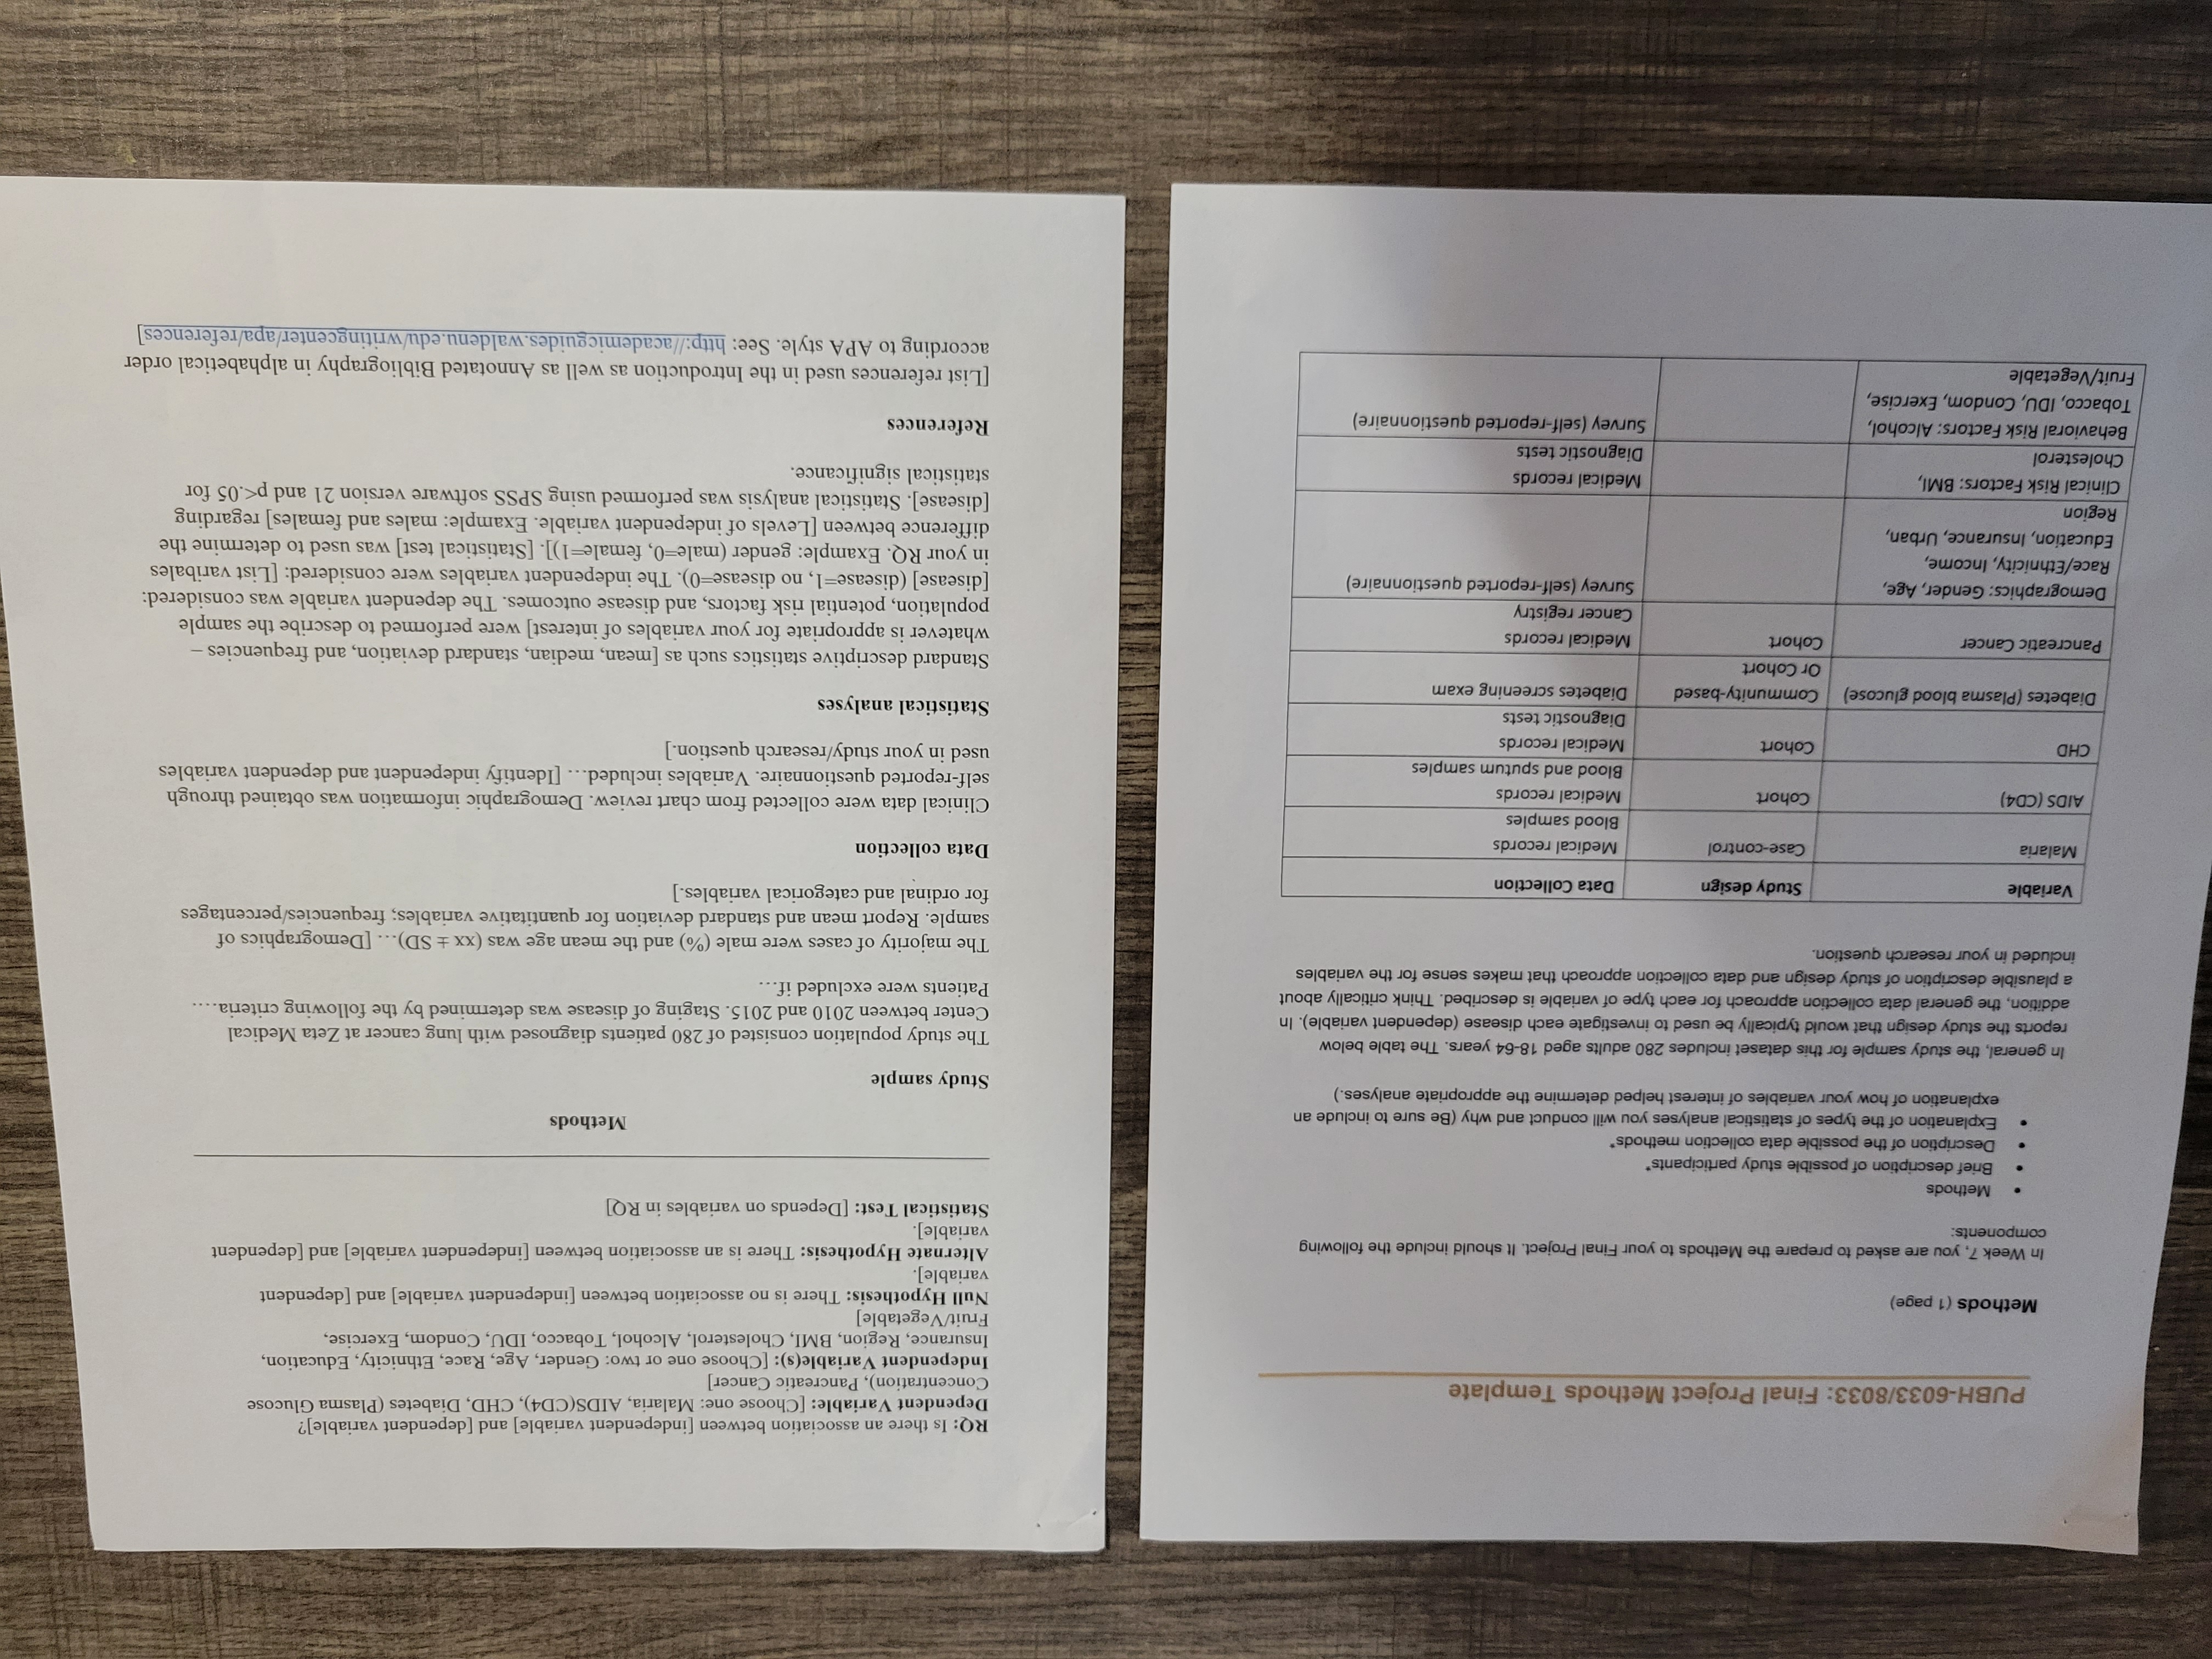
RQ: Is there an association between [independent variable] and [dependent variable]? Dependent Variable: [Choose one: Malaria, AIDS(CD4), CHD, Diabetes (Plasma Glucose PUBH-6033/8033: Final Project Methods Template Concentration), Pancreatic Cancer] Independent Variable(s): [Choose one or two: Gender, Age, Race, Ethnicity, Education, Insurance, Region, BMI, Cholesterol, Alcohol, Tobacco, IDU, Condom, Exercise, Fruit/Vegetable] Methods (1 page) Null Hypothesis: There is no association between [ independent variable] and [dependent variable]. In Week 7, you are asked to prepare the Methods to your Final Project. It should include the following Alternate Hypothesis: There is an association between [independent variable] and [dependent components: variable]. Statistical Test: [Depends on variables in RQ] Methods Brief description of possible study participants* Description of the possible data collection methods* Methods Explanation of the types of statistical analyses you will conduct and why (Be sure to include an explanation of how your variables of interest helped determine the appropriate analyses.) Study sample In general, the study sample for this dataset includes 280 adults aged 18-64 years. The table below The study population consisted of 280 patients diagnosed with lung cancer at Zeta Medical reports the study design that wou e used to investigate each disease (dependent variable). In Center between 2010 and 2015. Staging of disease was determined by the following criteria... addition, the general data coll ection approach for each type of variable is described. Think critically about Patients were excluded if... a plausible description of study design and data bach that makes sense for the variables included in your research question. The majority of cases were male (%) and the mean age was (xx + SD)... [Demographics of sample. Report mean and standard deviation for quantitative variables; frequencies/percentages for ordinal and categorical variables.] Variable Study design Data Collection Malaria Case-control Medical record Data collection Blood samples Clinical data were collected from chart review. Demographic information was obtained through AIDS (CD4) Cohor Medical records self-reported questionnaire. Variables included... [Identify independent and dependent variables Blood and sputum samples CHO used in your study/research question.] Cohort Medical records Diagnostic tests Statistical analyses Diabetes (Plasma blood glucose) Community-based Diabetes screening exam Or Cohort Standard descriptive statistics such as [ mean, median, standard deviation, and frequencies - Pancreatic Cancer Cohort Medical records whatever is appropriate for your variables of interest] were performed to describe the sample Cancer registry population, potential risk factors, and disease outcomes. The dependent variable was considered: Demographics: Gender, Age, Survey (self-reported questionnaire) [disease] (disease=1, no disease=0). The independent variables were considered: [List varibales Race/Ethnicity, Income, in your RQ. Example: gender (male=0, female=1)]. [Statistical test] was used to determine the Education, Insurance, Urban difference between [Levels of independent variable. Example: males and females] regarding Region [disease]. Statistical analysis was performed using SPSS software version 21 and p<.05 for clinical risk factors: bmi medical records statistical significance. cholesterol diagnostic tests behavioral alcohol survey questionnaire references tobacco idu condom exercise fruit used in the introduction as well annotated bibliography alphabetical order according to apa style. see: http: waldenu.edu>