

Answered step by step
Verified Expert Solution
Question
1 Approved Answer
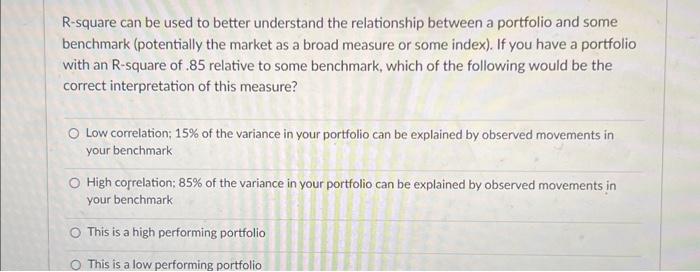
R-square can be used to better understand the relationship between a portfolio and some benchmark (potentially the market as a broad measure or some index).
Step by Step Solution
There are 3 Steps involved in it
Step: 1

Get Instant Access to Expert-Tailored Solutions
See step-by-step solutions with expert insights and AI powered tools for academic success
Step: 2

Step: 3
Ace Your Homework with AI
Get the answers you need in no time with our AI-driven, step-by-step assistance
Get Started
Your Money The Missing Manual
Authors: J.D. Roth
1st Edition
0596809409, 978-0596809409