

Answered step by step
Verified Expert Solution
Question
1 Approved Answer
Rules: II 1. Mention student ID, Name, Section Number, and Assignment-1 on the answer sheet and then write the answers. 2. COPYING is not permitted
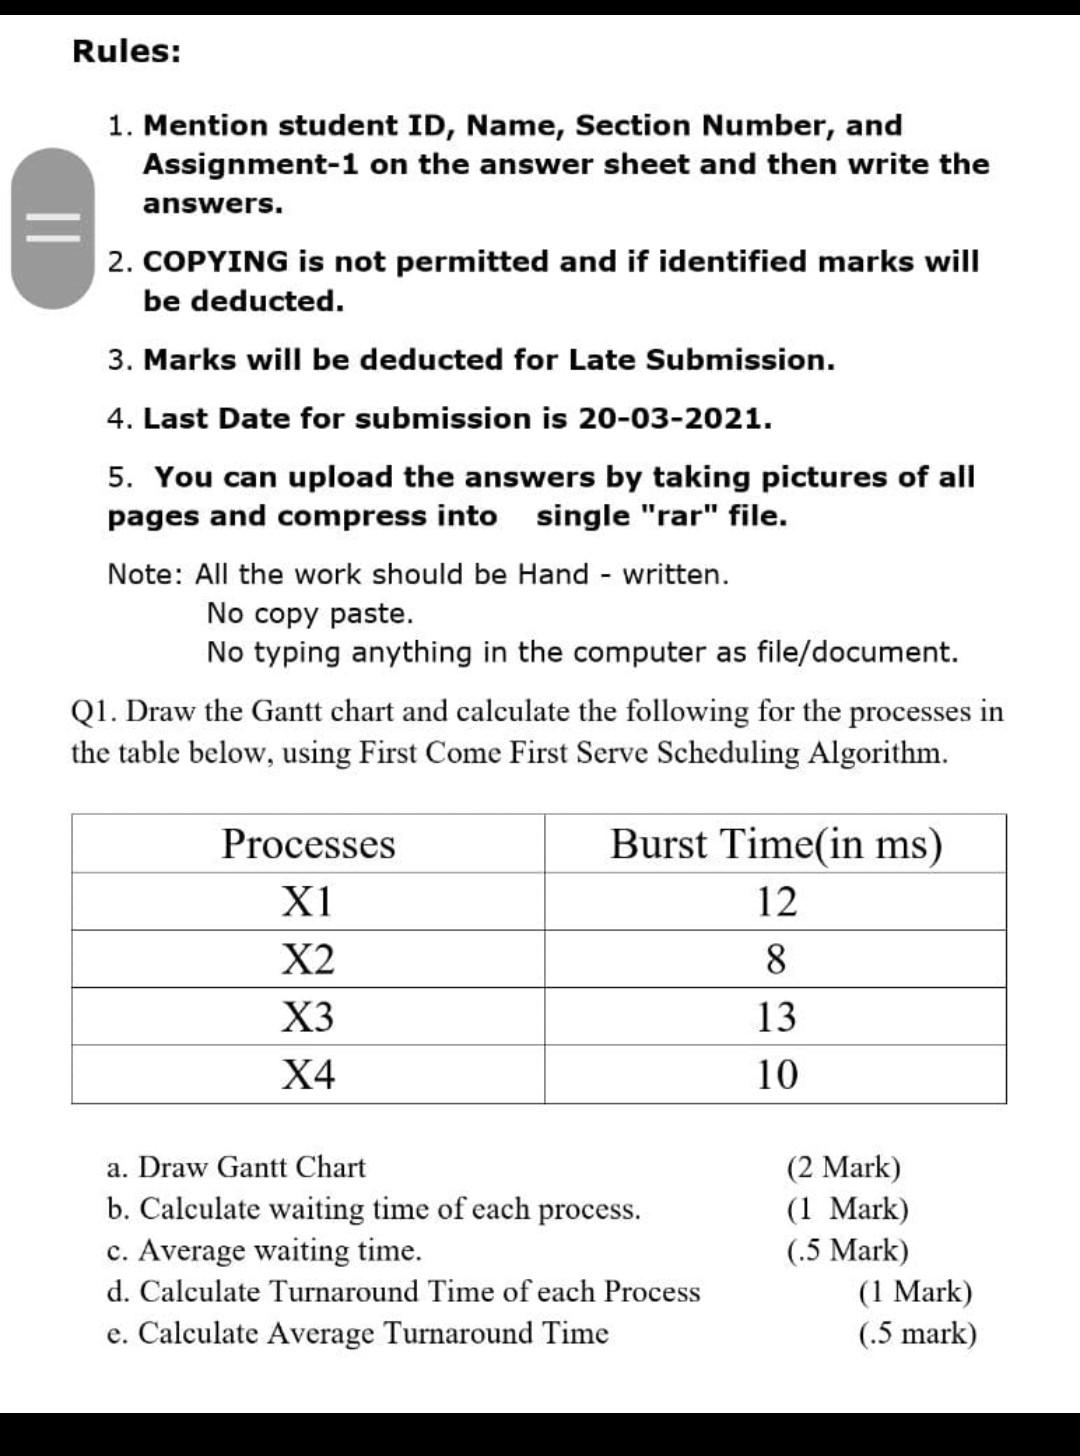
Rules: II 1. Mention student ID, Name, Section Number, and Assignment-1 on the answer sheet and then write the answers. 2. COPYING is not permitted and if identified marks will be deducted. 3. Marks will be deducted for Late Submission. 4. Last Date for submission is 20-03-2021. 5. You can upload the answers by taking pictures of all pages and compress into single "rar" file. Note: All the work should be Hand - written. No copy paste. No typing anything in the computer as file/document. Q1. Draw the Gantt chart and calculate the following for the processes in the table below, using First Come First Serve Scheduling Algorithm. Processes X1 X2 Burst Time in ms) 12 8 13 X3 X4 10 a. Draw Gantt Chart b. Calculate waiting time of each process. c. Average waiting time. d. Calculate Turnaround Time of each Process e. Calculate Average Turnaround Time (2 Mark) (1 Mark) (.5 Mark) (1 Mark) (.5 mark)
Step by Step Solution
There are 3 Steps involved in it
Step: 1

Get Instant Access to Expert-Tailored Solutions
See step-by-step solutions with expert insights and AI powered tools for academic success
Step: 2

Step: 3
Ace Your Homework with AI
Get the answers you need in no time with our AI-driven, step-by-step assistance
Get Started
Bioinformatics Databases And Systems
Authors: Stanley I. Letovsky
1st Edition
1475784058, 978-1475784053