

Question: Run the widget below to generate a carbon species plot like the one found on page 431 of your text book to answer the
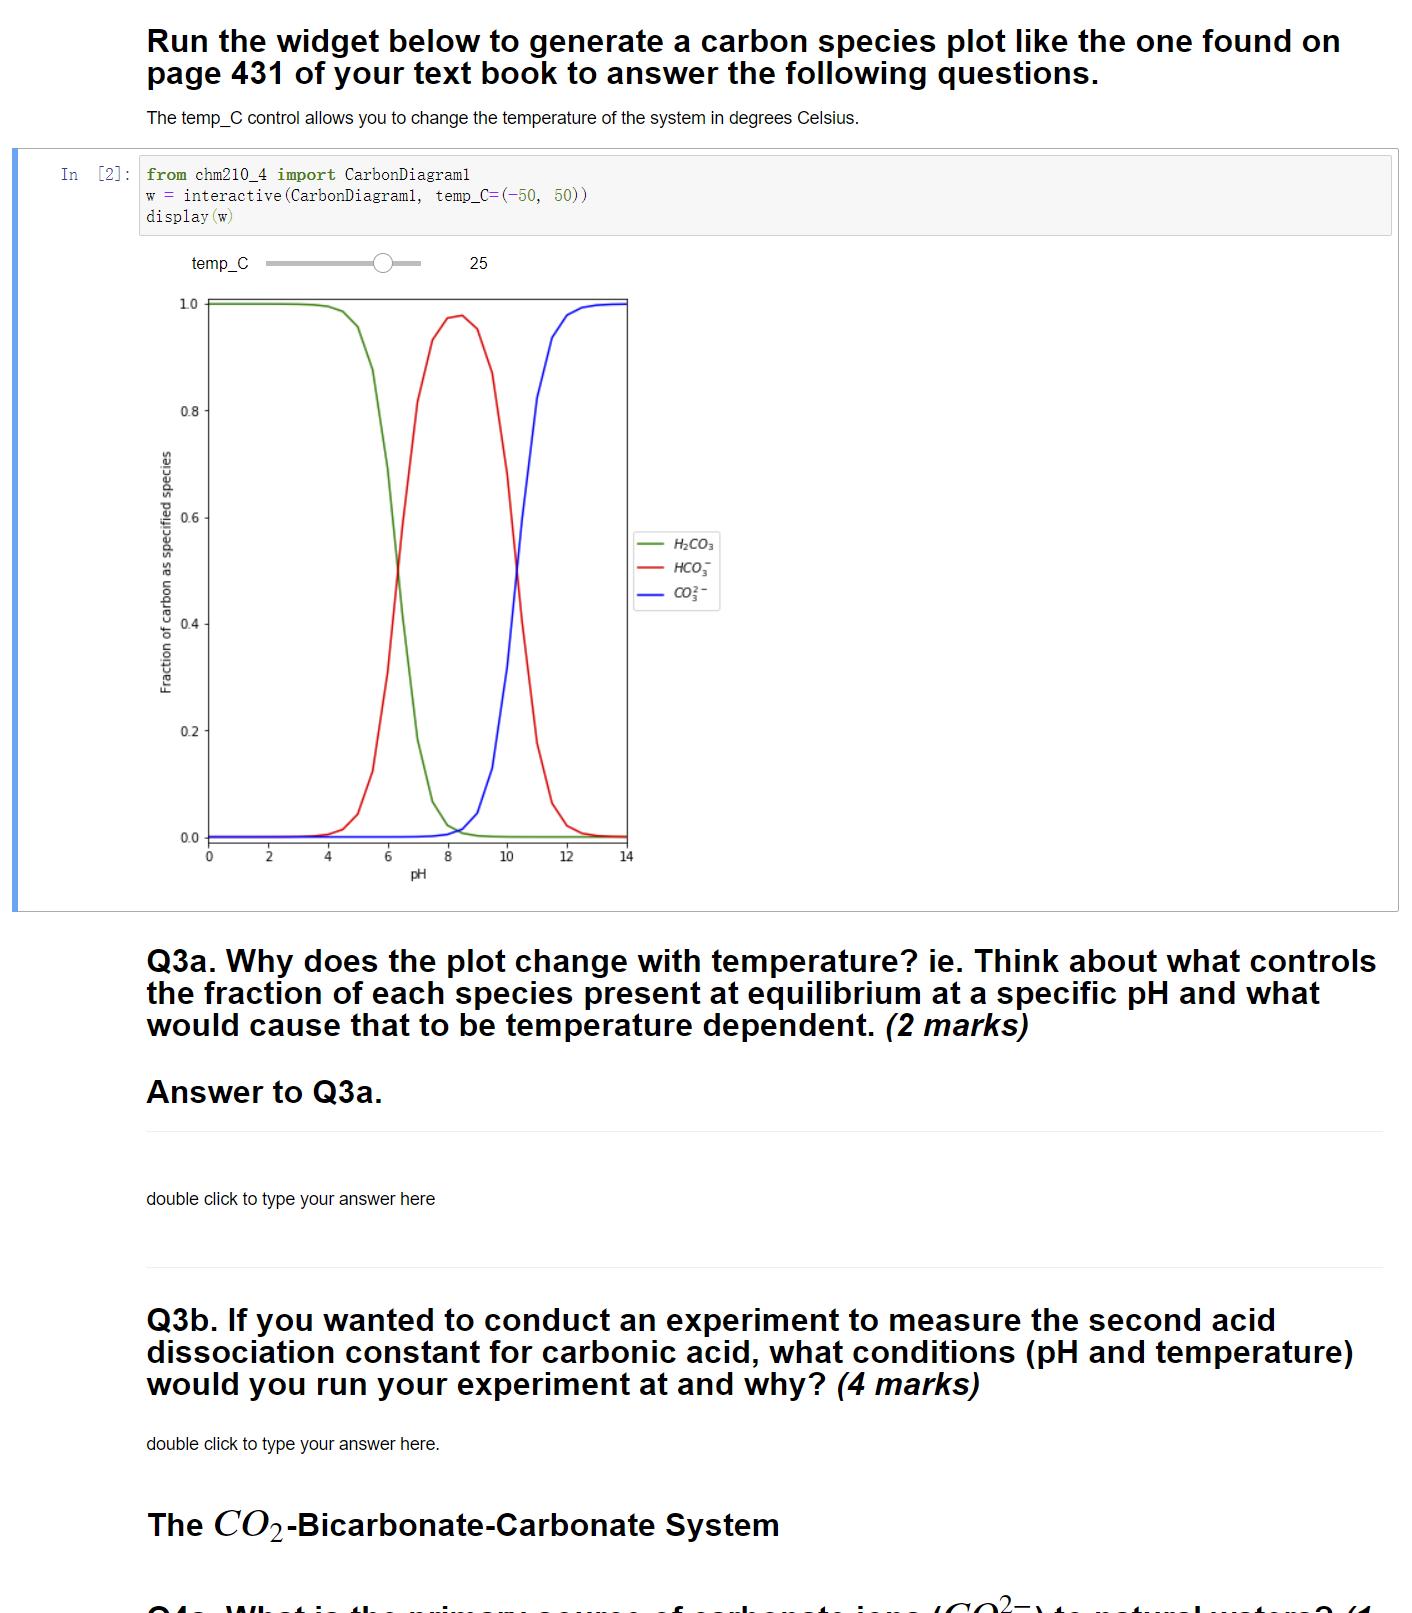
Run the widget below to generate a carbon species plot like the one found on page 431 of your text book to answer the following questions. The temp_C control allows you to change the temperature of the system in degrees Celsius. In [2]: from chm210 4 import CarbonDiagraml w = interactive (CarbonDiagraml, temp_C= (-50, 50)) display (w) temp_C 25 1.0 0.8 0.6 H2CO, HCO, - co3- 04 0.2 0.0 8 10 12 14 pH Q3a. Why does the plot change with temperature? ie. Think about what controls the fraction of each species present at equilibrium at a specific pH and what would cause that to be temperature dependent. (2 marks) Answer to Q3a. double click to type your answer here Q3b. If you wanted to conduct an experiment to measure the second acid dissociation constant for carbonic acid, what conditions (pH and temperature) would you run your experiment at and why? (4 marks) double click to type your answer here. The CO2-Bicarbonate-Carbonate System Fraction of carbon as specified species |||
Step by Step Solution
3.41 Rating (148 Votes )
There are 3 Steps involved in it

Get step-by-step solutions from verified subject matter experts