

Answered step by step
Verified Expert Solution
Question
1 Approved Answer
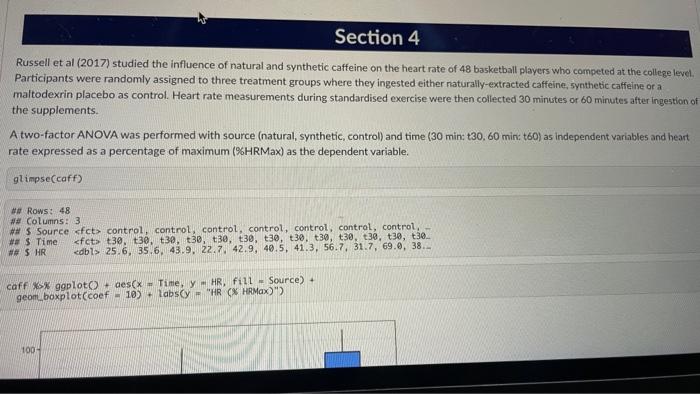
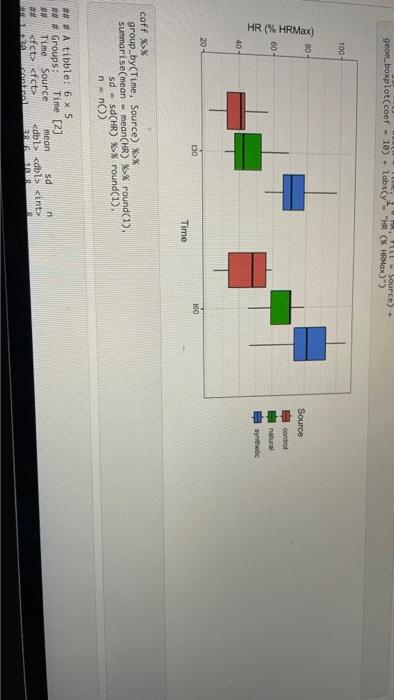
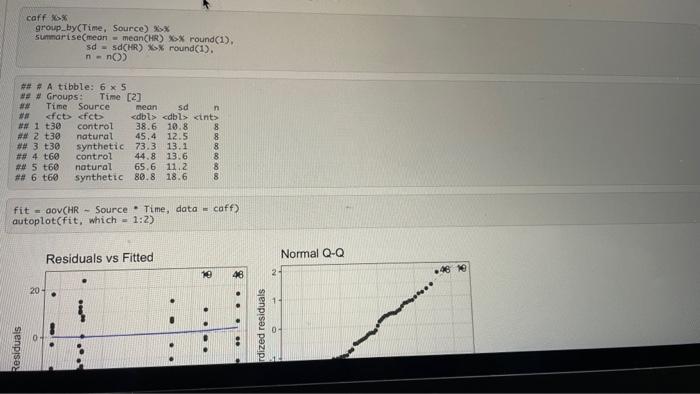
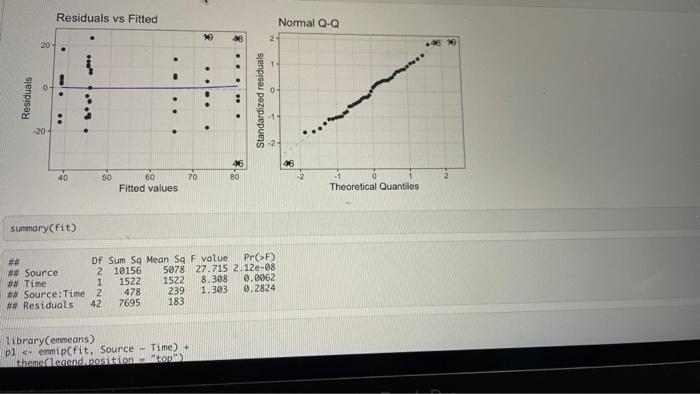
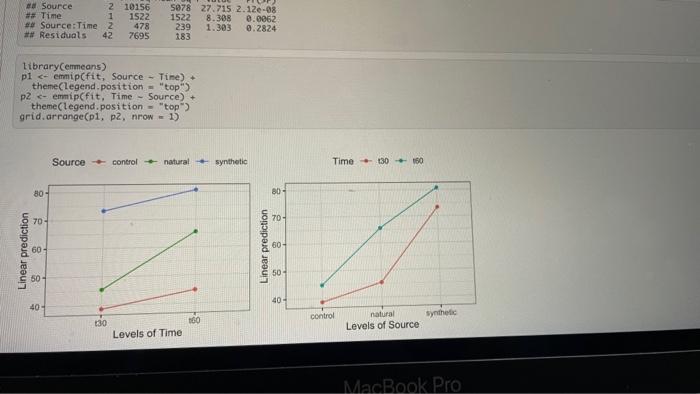
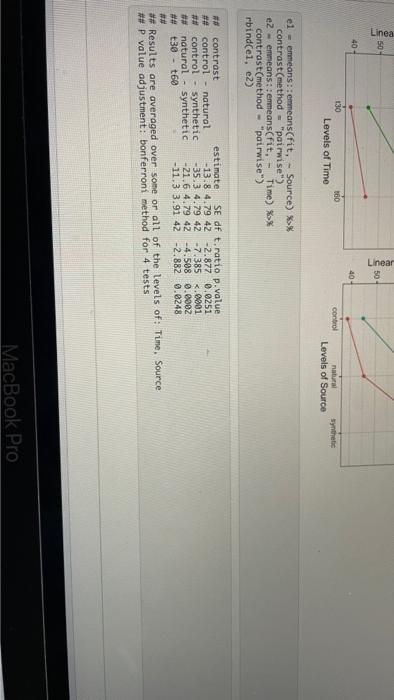
Russell et al (2017) studied the influence of natural and synthetic caffeine on the heart rate of 48 basketball players who competed at the college
Step by Step Solution
There are 3 Steps involved in it
Step: 1

Get Instant Access to Expert-Tailored Solutions
See step-by-step solutions with expert insights and AI powered tools for academic success
Step: 2

Step: 3
Ace Your Homework with AI
Get the answers you need in no time with our AI-driven, step-by-step assistance
Get Started
Data Analytics Systems Engineering Cybersecurity Project Management
Authors: Christopher Greco
1st Edition
168392648X, 978-1683926481