Rvision questions
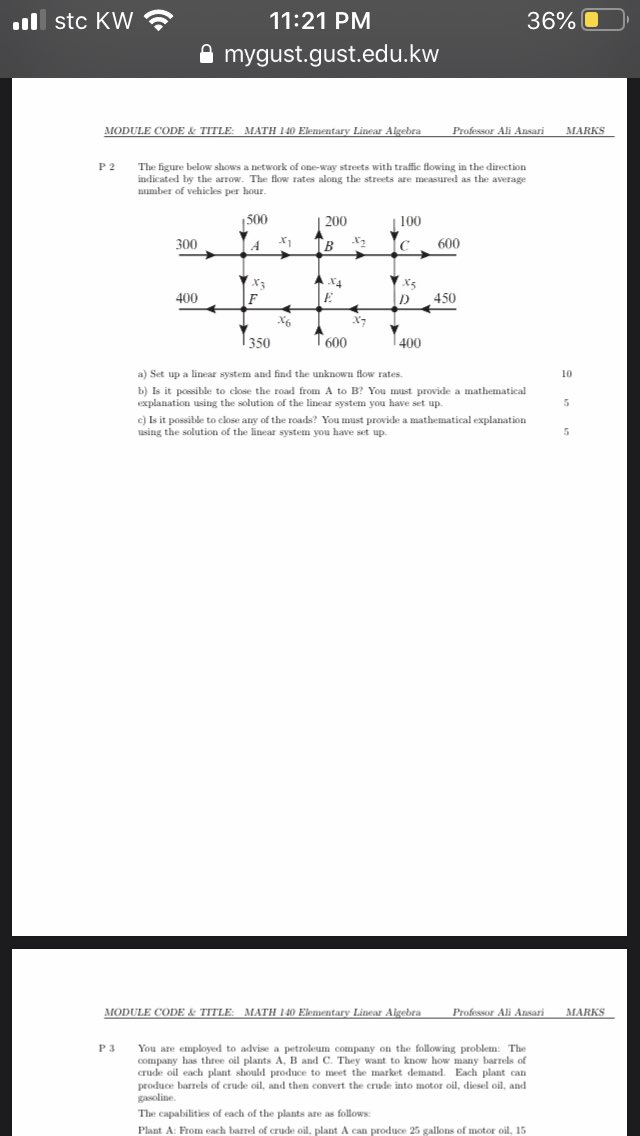
al stc KW 11:21 PM 36% mygust.gust.edu.kw C 3 of 3 & TITLE: MATH 140 Elementary Linear Algebra Professor Ali Ansari MARKS P3 You are employed to advise a petroleum company on the following problem: The company has three oil plants A. B and C. They want to know how many barrels of crude oil each plant should produce to meet the market demand. Each plant can produce barrels of crude oil, and then convert the crude into motor oil, diesel oil, and gasoline. The capabilities of each of the plants are as follows: Plant A: From each barrel of crude oil, plant A can produce 25 gallons of motor oil. 15 gallons of diesel, and 5 gallons of gasoline. Plant B: From each barrel of crude oil, plant B can produce 3 gallons of motor oil, 14 gallons of diesel, and 5 gallons of gasoline. Plant C: From each barrel of crude oil, plant C can produce 4 gallons of motor oil, 5 gallons of diesel, and 12 gallons of gasoline. The current demand in the local market is for 2280 gallons of motor oil, 1800 gallons of diesel, and 990 gallons of gasoline. a) Set up linear equations to model this problem, in terms of how many barrels each plant should produce to meet the demand. 10 b) If plants B and C break down temporarily, how many barrels should plant A produce to meet a demand of 400 gallons of motor oil, 200 gallons of diesel and 100 gallons of gasoline. c) If plant A breaks down only, and plants B and C are functioning. find an example of quantities of demand for motor oil, diesel, and gasoline which could NOT be met exactly (Le. without wastage). mal stc KW 11:21 PM 36% A mygust.gust.edu.kw MODULE CODE & TITLE: MATH 140 Elementary Linear Algebra Professor Ali Ansari MARKS P2 The figure below shows a network of one-way streets with traffic flowing in the direction indicated by the arrow. The flow rates along the streets are measured as the average number of vehicles per hour. 1500 |200 100 300 A B C 600 400 F E D 450 X6 350 T 600 400 a) Set up a linear system and find the unknown flow rates. 10 b) Is it possible to close the road from A to B? You must provide a mathematical explanation using the solution of the linear system you have set up. c) Is it possible to close any of the roads? You must provide a mathematical explanation using the solution of the linear system you have set up. 5 MODULE CODE & TITLE: MATH 140 Elementary Linear Algebra Professor All Ansari MARKS P 3 You are employed to advise a petroleum company on the following problem: The company has three oil plants A. B and C. They want to know how many barrels of crude oil each plant should produce to meet the market demand. Each plant can produce barrels of crude oil, and then convert the crude into motor oil, diesel oil, and gasoline. The capabilities of each of the plants are as follows: Plant A: From each barrel of crude oil. plant A can produce 25 gallons of motor oil, 15al stc KW 11:21 PM 36% mygust.gust.edu.kw GULF UNIVERSITY for SCIENCE & TECHNOLOGY Assignment MODULE CODE & TITLE: MATH 140 Elementary Linear Algebra INSTRUCTOR Professor Ali Ansari SEMESTER: Summer 2020 DEADLINE: Submission deadline is July 30th. 2020 This project requires you to solve the following problems. Some problems may require the tie of a computer. It will be indicated where this is required. P1 The following data point have been recorded for a particular experiment: (1,2). (2.5). (3,9), (4,12), (5, 21). (6,35). Set up the linear system that will enable you to compute the coefficients of the poly- nomial. To solve the system please use an algorithm and associated code to solve. It is recommended that Python be used however other languages will be accepted with prior email approval. 20 Please note that for part b provide the following: 1. Your python code as a txt file which can be copy-pasted into the compiler 2. All variable definitions explaining clearly what they are used for 3. Output to be expected should clearly have wording indicating the solution. MODULE CODE & TITLE: MATH 140 Elementary Linear Algebra Professor Ali Ansari MARKS P2 The figure below shows a network of one-way streets with traffic flowing in the direction indicated by the arrow. The flow rates along the streets are measured as the average number of vehicles per hour. $500 200 1 100