

Answered step by step
Verified Expert Solution
Question
1 Approved Answer
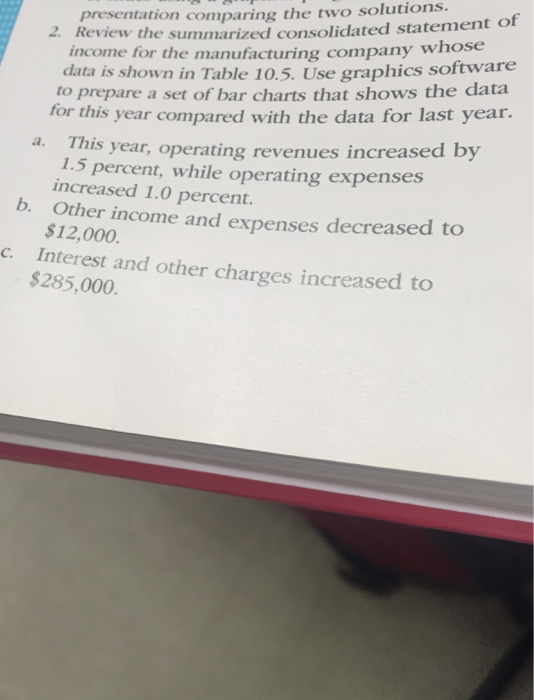
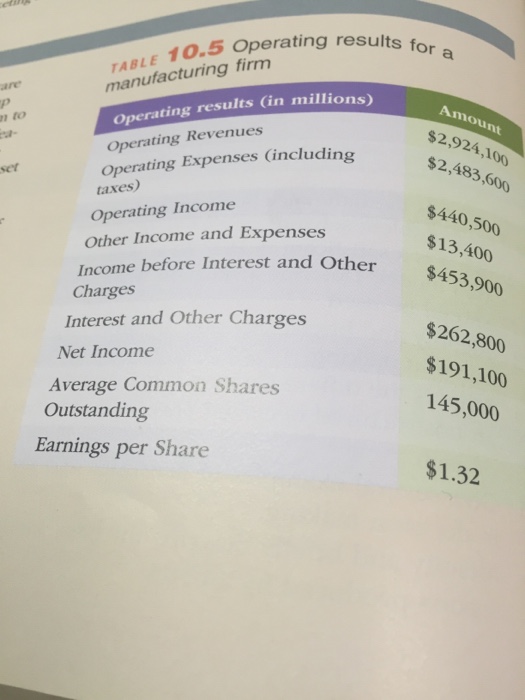
s. presentation comparing the two solution 2. Revie wthe summarized consolidated statement of se income for the manufacturing company who data is shown in Table

Step by Step Solution
There are 3 Steps involved in it
Step: 1

Get Instant Access to Expert-Tailored Solutions
See step-by-step solutions with expert insights and AI powered tools for academic success
Step: 2

Step: 3
Ace Your Homework with AI
Get the answers you need in no time with our AI-driven, step-by-step assistance
Get Started
Aviation Tax IRS Audit Techniques Guide
Authors: Internal Revenue Service
1st Edition
1304131696, 978-1304131690