

Answered step by step
Verified Expert Solution
Question
1 Approved Answer
Sakinah has created a bar chart on Excel for the data analysis. But she was asked to use a column cha represent the data. How
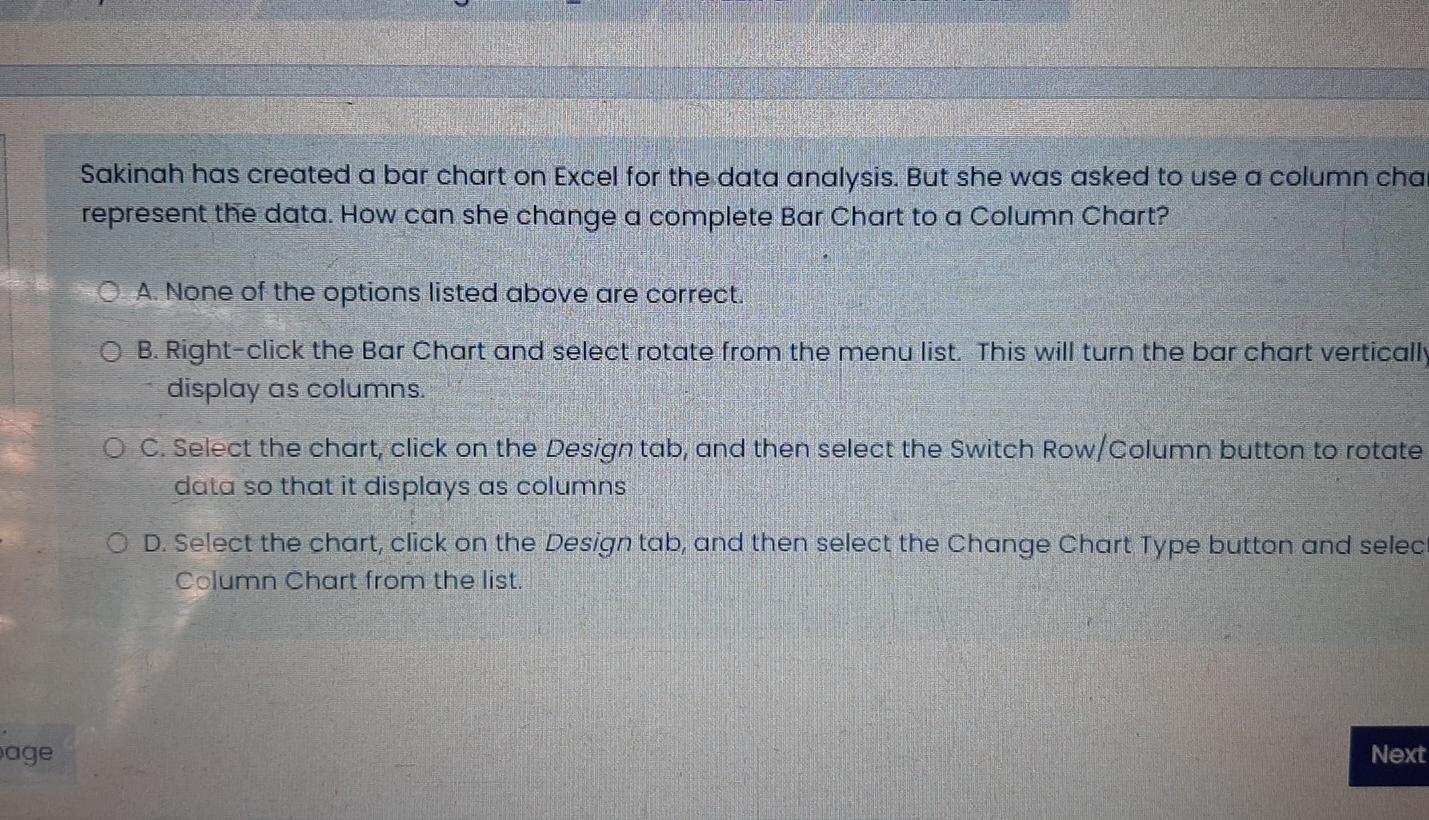
Sakinah has created a bar chart on Excel for the data analysis. But she was asked to use a column cha represent the data. How can she change a complete Bar Chart to a Column Chart? 0. A. None of the options listed above are correct. O B. Right-click the Bar Chart and select rotate from the menu list. This will turn the bar chart vertically display as columns. O C. Select the chart, click on the Design tab, and then select the Switch Row/Column button to rotate data so that it displays as columns O D. Select the chart, click on the Design tab, and then select the Change Chart Type button and selec Column Chart from the list. age Next
Step by Step Solution
There are 3 Steps involved in it
Step: 1

Get Instant Access to Expert-Tailored Solutions
See step-by-step solutions with expert insights and AI powered tools for academic success
Step: 2

Step: 3
Ace Your Homework with AI
Get the answers you need in no time with our AI-driven, step-by-step assistance
Get Started
Time Series Databases New Ways To Store And Access Data
Authors: Ted Dunning, Ellen Friedman
1st Edition
1491914726, 978-1491914724