

Answered step by step
Verified Expert Solution
Question
1 Approved Answer
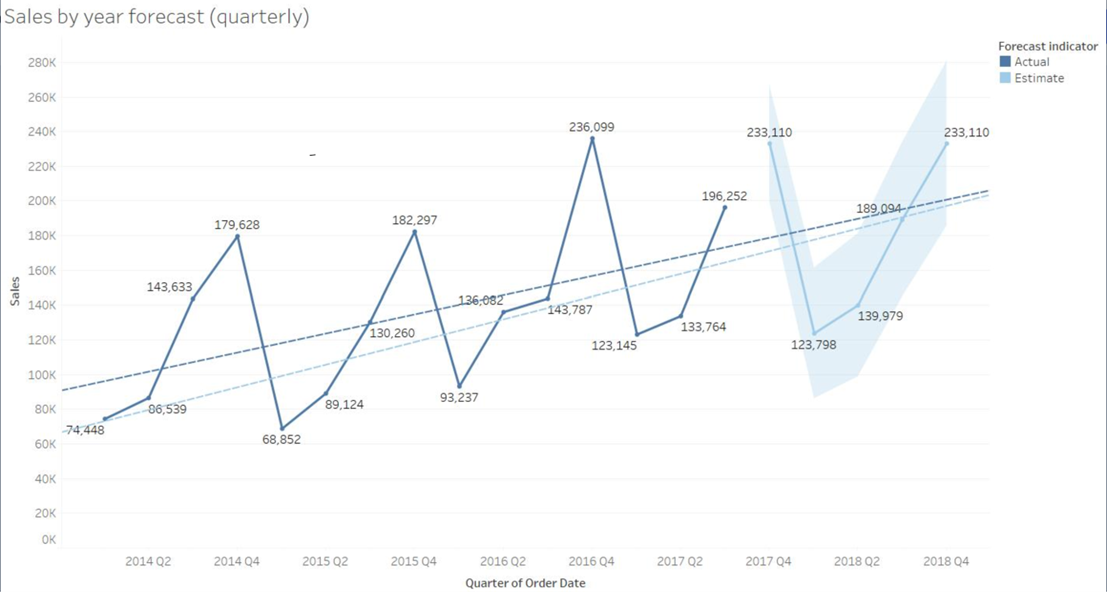
Sales by year forecast (quarterly) Forecast indicator 280K Actual Estimate 260K 240K 236,099 233,110 233,110 220K 20OK 196,252 189,094- 179,628 182,297 180K 160K 143,633 Sales
Step by Step Solution
There are 3 Steps involved in it
Step: 1

Get Instant Access to Expert-Tailored Solutions
See step-by-step solutions with expert insights and AI powered tools for academic success
Step: 2

Step: 3
Ace Your Homework with AI
Get the answers you need in no time with our AI-driven, step-by-step assistance
Get Started
The Power Of Laws
Authors: Terence K Moloisane
1st Edition
B08Z7HTFTJ, B0CP2YDQDK