Answered step by step
Verified Expert Solution
Link Copied!

Question

1 Approved Answer

Sales Cost of goods sold Accounts receivable 2019 2018 2017 2016 2015 $ 535,783 $ 347,911 $ 285,173 $ 198,037 $ 148,900 270, 342 175,556
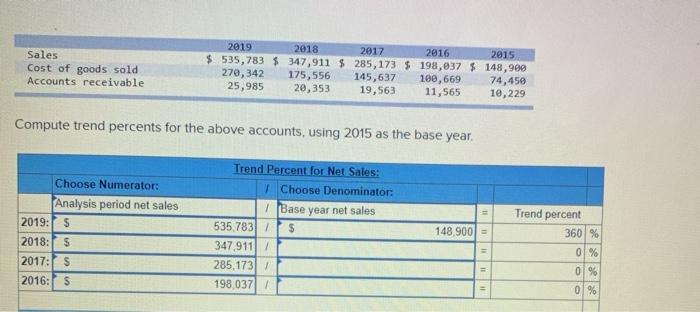
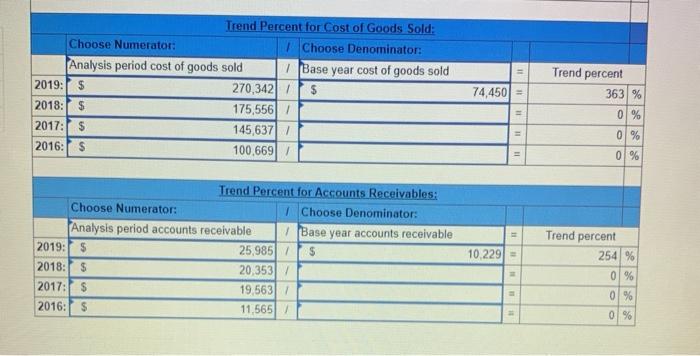
image text in transcribed
Sales Cost of goods sold Accounts receivable 2019 2018 2017 2016 2015 $ 535,783 $ 347,911 $ 285,173 $ 198,037 $ 148,900 270, 342 175,556 145,637 100,669 74,450 25,985 20,353 19,563 11,565 10, 229 Compute trend percents for the above accounts, using 2015 as the base year Choose Numerator: Analysis period net sales 2019: S 2018: $ 2017: $ 2016: S Trend Percent for Net Sales: | Choose Denominator: I Base year net sales 535,783 $ 347.911/ 285.173 198 037/ Trend percent 360 % 148.900 = 0 % 01% 0 % Trend percent Trend Percent for Cost of Goods Sold: Choose Numerator: 1 Choose Denominator: Analysis period cost of goods sold Base year cost of goods sold 2019: $ 270,3421 / $ 2018: $ 175,556 / 2017: $ 145,6377 2016: $ 100,669 / 74,450 = 363 % 0 % 0 % III 0 % = Trend Percent for Accounts Receivables: Choose Numerator: Choose Denominator: Analysis period accounts receivable Base year accounts receivable 2019: $ 25,985 $ 2018: $ 20,353/ 2017: S 19,5631 2016: $ 11,565 Trend percent 254 % 10,229 = 0 % 0 % 01%

Step by Step Solution

There are 3 Steps involved in it

Step: 1

blur-text-image

Get Instant Access to Expert-Tailored Solutions

See step-by-step solutions with expert insights and AI powered tools for academic success

Step: 2

blur-text-image

Step: 3

blur-text-image

Ace Your Homework with AI

Get the answers you need in no time with our AI-driven, step-by-step assistance

Get Started

Recommended Textbook for

Auto Body And Repair Industry IRS Audit Techniques Guide

Authors: Internal Revenue Service

1st Edition

1304131661, 978-1304131669

Students also viewed these Accounting questions

Question

Why We Form Relationships Managing Relationship Dynamics?

Answered: 1 week ago