Answered step by step
Verified Expert Solution
Link Copied!

Question

1 Approved Answer

Sales Cost of goods sold Accounts receivable 2019 2018 2017 2016 2015 $ 529,519 $ 348,368 $ 275,390 $ 189,924 $ 142,800 261,914 172,450 138,
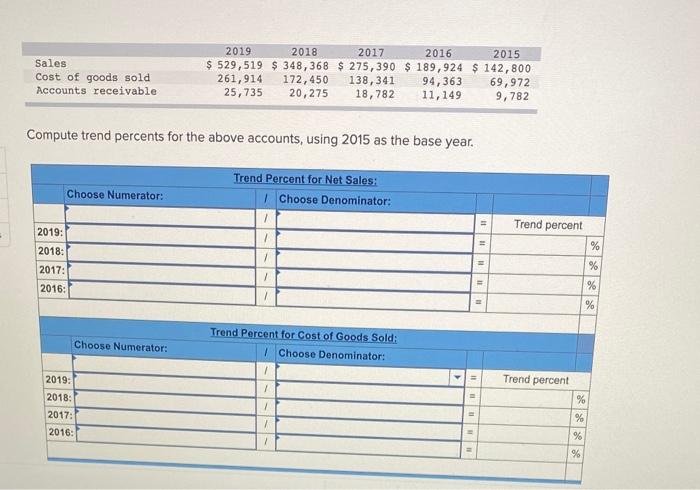
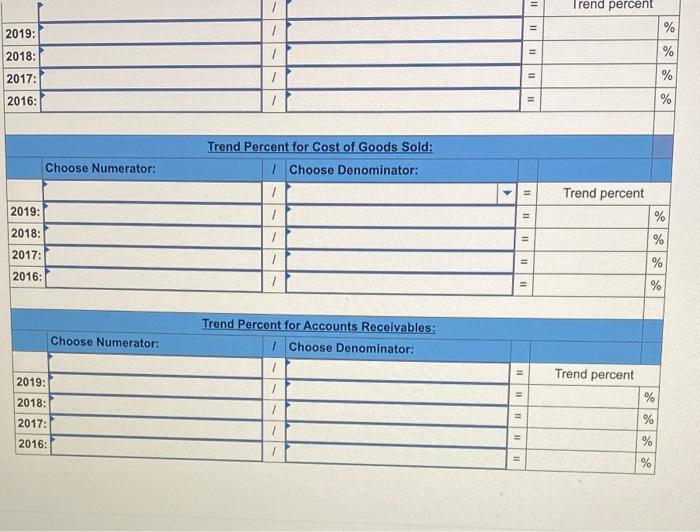
image text in transcribed
Sales Cost of goods sold Accounts receivable 2019 2018 2017 2016 2015 $ 529,519 $ 348,368 $ 275,390 $ 189,924 $ 142,800 261,914 172,450 138, 341 94,363 69,972 25,735 20,275 18,782 11,149 9,782 Compute trend percents for the above accounts, using 2015 as the base year. Choose Numerator: Trend Percent for Net Sales: Choose Denominator: 1 Trend percent 2019: % 2018: % 2017: 2016: % 11 % Choose Numerator: Trend Percent for Cost of Goods Sold: 1 Choose Denominator: - 11 Trend percent % 2019: 2018: 2017: 2016: / % % % 11 Trend percent 11 2019: % % % 11 2018: 11 2017: 2016: 11 % Trend Percent for Cost of Goods Sold: 1 Choose Denominator: Choose Numerator: 11 2019: / Trend percent % % % 2018: 111 2017: 2016: = % Choose Numerator: Trend Percent for Accounts Receivables: 1 Choose Denominator: 1 1 11 Trend percent = % 2019: 2018: 2017: 2016: % 111111 % %

Step by Step Solution

There are 3 Steps involved in it

Step: 1

blur-text-image

Get Instant Access to Expert-Tailored Solutions

See step-by-step solutions with expert insights and AI powered tools for academic success

Step: 2

blur-text-image

Step: 3

blur-text-image

Ace Your Homework with AI

Get the answers you need in no time with our AI-driven, step-by-step assistance

Get Started

Recommended Textbook for

How Charts Can Help You In The Stock Market

Authors: William Jiler

1st Edition

1265641218, 978-1265641214

More Books

Students also viewed these Accounting questions

Question

3-22. General purpose:

Answered: 1 week ago