Answered step by step
Verified Expert Solution
Link Copied!

Question

1 Approved Answer

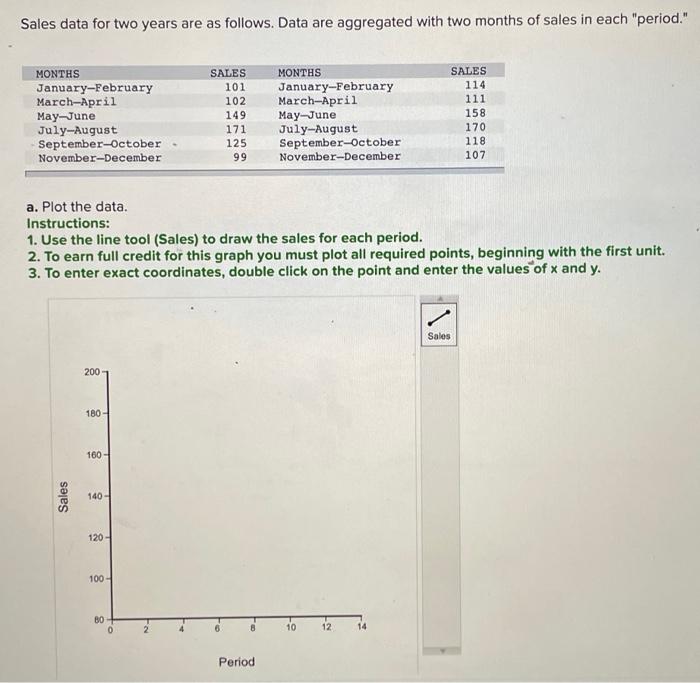
Sales data for two years are as follows. Data are aggregated with two months of sales in each period. a. Plot the data. Instructions: 1.

image text in transcribed
Sales data for two years are as follows. Data are aggregated with two months of sales in each "period." a. Plot the data. Instructions: 1. Use the line tool (Sales) to draw the sales for each period. 2. To earn full credit for this graph you must plot all required points, beginning with the first unit. 3. To enter exact coordinates, double click on the point and enter the values of x and y. b. Fit a simple linear regression model to the sales data. (Do not round intermediate calculations. Round your answers to 3 decimal places.) c-1. In addition to the regression model, determine multiplicative seasonal index factors. A full cycle is assumed to be a full year. (Do not round intermediate calculations. Round your answers to 3 decimal places.) c-2. Fit a regression model to the descasonalized soles data. (Do not round intermediate calculations. Round your answers to 3 decimal places.) d. Prepare sales forecasts for next year using both of your regression models derived above to show results both with and without adjustments for seasonality. (Do.not round intermediate calculations. Round your answers to 3 decimal places.) Sales data for two years are as follows. Data are aggregated with two months of sales in each "period." a. Plot the data. Instructions: 1. Use the line tool (Sales) to draw the sales for each period. 2. To earn full credit for this graph you must plot all required points, beginning with the first unit. 3. To enter exact coordinates, double click on the point and enter the values of x and y. b. Fit a simple linear regression model to the sales data. (Do not round intermediate calculations. Round your answers to 3 decimal places.) c-1. In addition to the regression model, determine multiplicative seasonal index factors. A full cycle is assumed to be a full year. (Do not round intermediate calculations. Round your answers to 3 decimal places.) c-2. Fit a regression model to the descasonalized soles data. (Do not round intermediate calculations. Round your answers to 3 decimal places.) d. Prepare sales forecasts for next year using both of your regression models derived above to show results both with and without adjustments for seasonality. (Do.not round intermediate calculations. Round your answers to 3 decimal places.)

Step by Step Solution

There are 3 Steps involved in it

Step: 1

blur-text-image

Get Instant Access to Expert-Tailored Solutions

See step-by-step solutions with expert insights and AI powered tools for academic success

Step: 2

blur-text-image

Step: 3

blur-text-image

Ace Your Homework with AI

Get the answers you need in no time with our AI-driven, step-by-step assistance

Get Started

Recommended Textbook for

Credentialing Audits Tools For Compliance And Reduced Liability

Authors: CPMSM Vicki L. Searcy

1st Edition

1578398584, 978-1578398584

More Books

Students also viewed these Accounting questions