Answered step by step
Verified Expert Solution
Question
1 Approved Answer
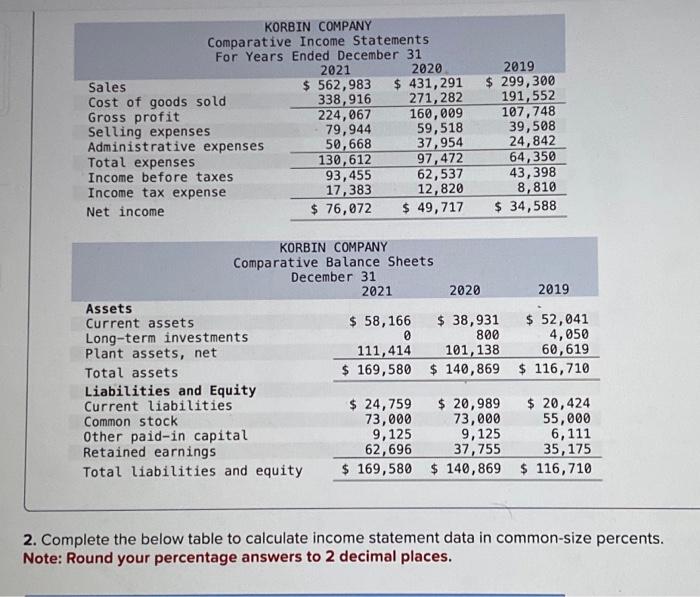
Sales KORBIN COMPANY Comparative Income Statements For Years Ended December 31 Cost of goods sold Gross profit 2021 2020 $ 562,983 $ 431,291 2019


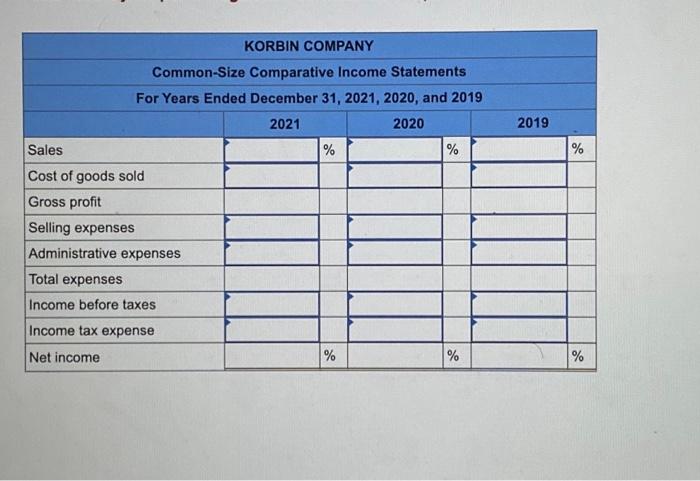
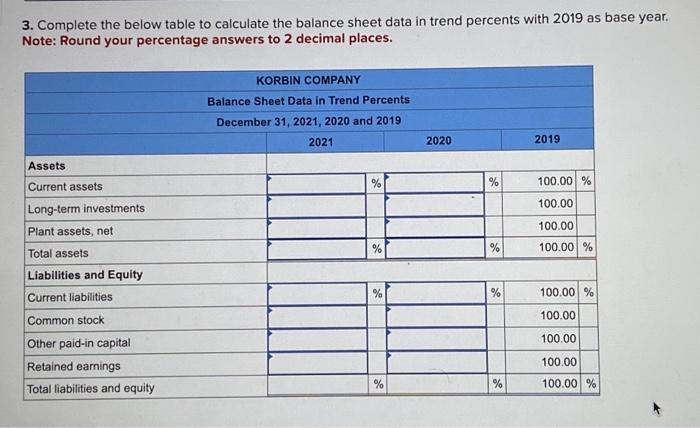
Sales KORBIN COMPANY Comparative Income Statements For Years Ended December 31 Cost of goods sold Gross profit 2021 2020 $ 562,983 $ 431,291 2019 $ 299,300 338,916 271,282 191,552 224,067 160,009 107,748 Selling expenses 79,944 59,518 39,508 Administrative expenses 50,668 37,954 24,842 Total expenses 130,612 97,472 64,350 Income before taxes 93,455 62,537 43,398 Income tax expense 17,383 12,820 8,810 Net income $ 76,072 $ 49,717 $ 34,588 KORBIN COMPANY Comparative Balance Sheets December 31 Assets Current assets Long-term investments Plant assets, net Total assets Liabilities and Equity Current liabilities Common stock Other paid-in capital Retained earnings Total liabilities and equity 111,414 $ 169,580 $ 140,869 2021 2020 $ 58,166 0 $ 38,931 800 101,138 2019 $ 52,041 4,050 60,619 $ 116,710 $ 24,759 $ 20,989 $ 20,424 73,000 73,000 55,000 9,125 9,125 6,111 62,696 37,755 35,175 $ 169,580 $ 140,869 $ 116,710 2. Complete the below table to calculate income statement data in common-size percents. Note: Round your percentage answers to 2 decimal places. KORBIN COMPANY Common-Size Comparative Income Statements For Years Ended December 31, 2021, 2020, and 2019 Sales Cost of goods sold Gross profit Selling expenses Administrative expenses Total expenses Income before taxes Income tax expense Net income 2021 % 2020 2019 % % % % % 3. Complete the below table to calculate the balance sheet data in trend percents with 2019 as base year. Note: Round your percentage answers to 2 decimal places. KORBIN COMPANY Balance Sheet Data in Trend Percents December 31, 2021, 2020 and 2019 2021 2020 2019 Assets Current assets Long-term investments % % 100.00 % 100.00 Plant assets, net 100.00 Total assets % % 100.00 % Liabilities and Equity Current liabilities % % 100.00% Common stock Other paid-in capital Retained earnings Total liabilities and equity 100.00 100.00 100.00 % 100.00%
Step by Step Solution
There are 3 Steps involved in it
Step: 1
Okay lets calculate the commonsize comparative income statements and balance sheet data in trend p...
Get Instant Access to Expert-Tailored Solutions
See step-by-step solutions with expert insights and AI powered tools for academic success
Step: 2

Step: 3

Ace Your Homework with AI
Get the answers you need in no time with our AI-driven, step-by-step assistance
Get Started


