 .
.
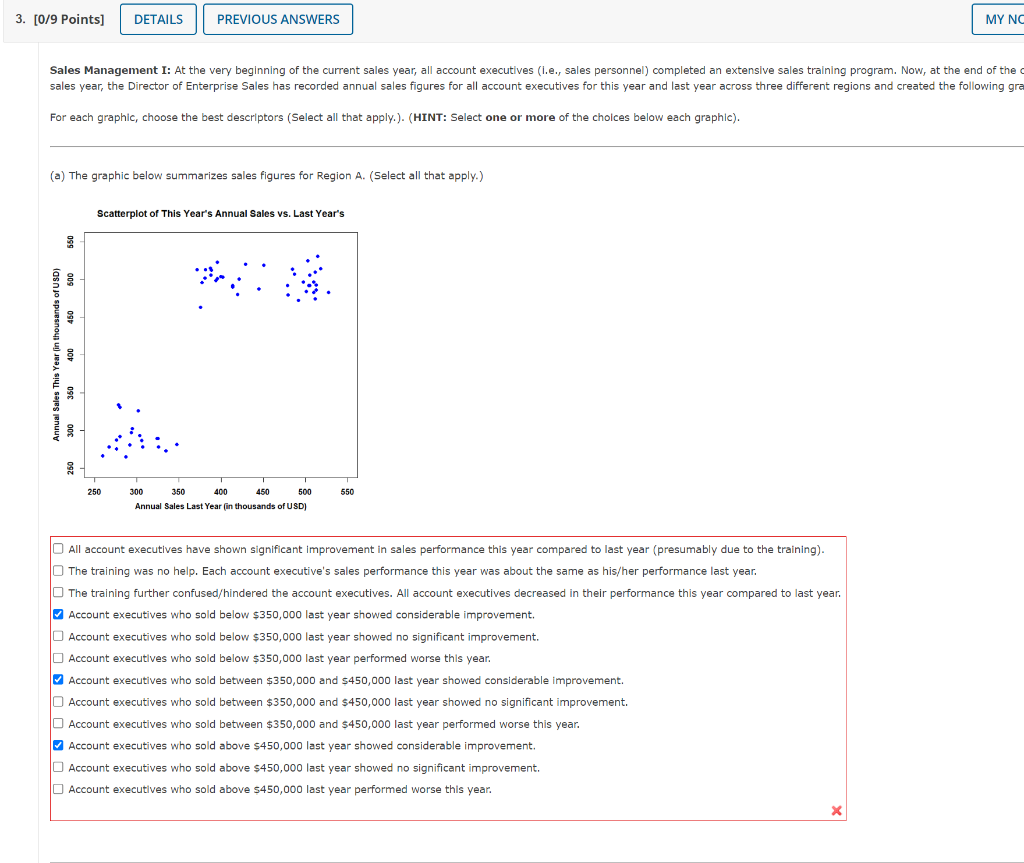
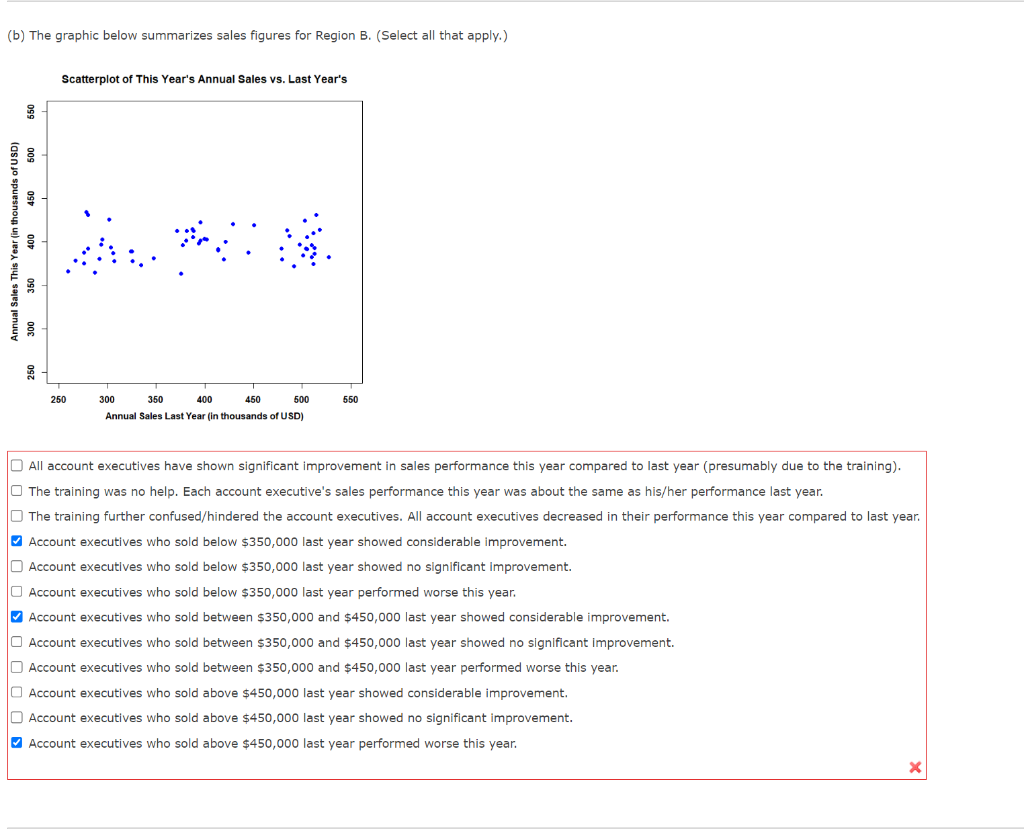
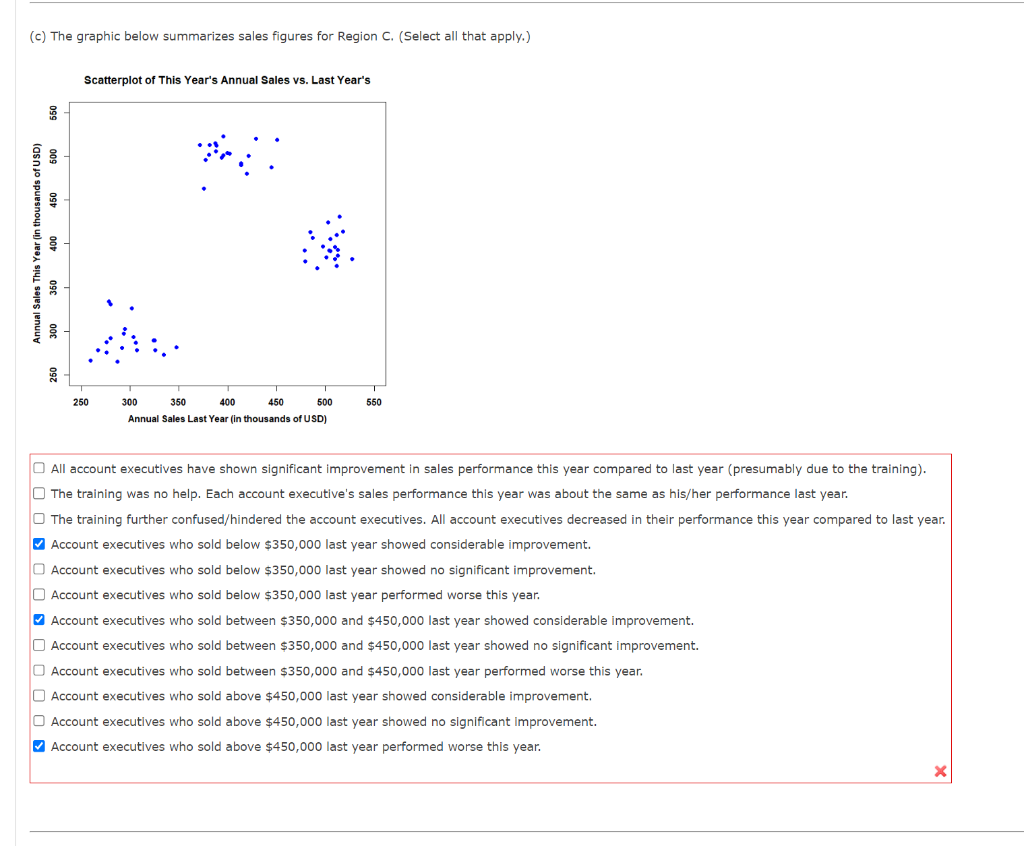
Sales Management I: At the very beginning of the current sales year, all account executives (i.e., sales personnel) completed an extensive sales training program. Now, at the end of the sales year, the Director of Enterprise Sales has recorded annual sales figures for all account executives for this year and last year across three different regions and created the following gra For each graphic, choose the best descriptors (Select all that apply.). (HINT: Select one or more of the cholces below each graphic). (a) The graphic below summarizes sales figures for Region A. (Select all that apply.) Scatterplot of This Year's Annual Sales vs. Last Year's All account executives have shown significant improvement in sales performance this year compared to last year (presumably due to the training). The training was no help. Each account executive's sales performance this year was about the same as his/her performance last year. The training further confused/hindered the account executives. All account executives decreased in their performance this year compared to last year. Account executives who sold below $350,000 last year showed considerable improvement. Account executives who sold below $350,000 last year showed no significant improvement. Account executlves who sold below $350,000 last year performed worse this year. Account executives who sold between $350,000 and $450,000 last year showed considerable improvement. Account executives who sold between $350,000 and $450,000 last year showed no significant improvement. Account executives who sold between $350,000 and $450,000 last year performed worse this year. Account executives who sold above $450,000 last year showed considerable improvement. Account executives who sold above $450,000 last year showed no significant improvement. Account executives who sold above $450,000 last year performed worse this year. (b) The graphic below summarizes sales figures for Region B. (Select all that apply.) Scatterplot of This Year's Annual Sales vs. Last Year's All account executives have shown significant improvement in sales performance this year compared to last year (presumably due to the training). The training was no help. Each account executive's sales performance this year was about the same as his/her performance last year. The training further confused/hindered the account executives. All account executives decreased in their performance this year compared to last year. Account executives who sold below $350,000 last year showed considerable improvement. Account executives who sold below $350,000 last year showed no signifleant improvement. Account executives who sold below $350,000 last year performed worse this year. Account executives who sold between $350,000 and $450,000 last year showed considerable improvement. Account executives who sold between $350,000 and $450,000 last year showed no significant improvement. Account executives who sold between $350,000 and $450,000 last year performed worse this year. Account executives who sold above $450,000 last year showed considerable improvement. Account executives who sold above $450,000 last year showed no significant improvement. Account executives who sold above $450,000 last year performed worse this year. (c) The graphic below summarizes sales figures for Region C. (Select all that apply.) Scatterplot of This Year's Annual Sales vs. Last Year's All account executives have shown significant improvement in sales performance this year compared to last year (presumably due to the training). The training was no help. Each account executive's sales performance this year was about the same as his/her performance last year. The training further confused/hindered the account executives. All account executives decreased in their performance this year compared to last year. Account executives who sold below $350,000 last year showed considerable improvement. Account executives who sold below $350,000 last year showed no significant improvement. Account executives who sold below $350,000 last year performed worse this year. Account executives who sold between $350,000 and $450,000 last year showed considerable improvement. Account executives who sold between $350,000 and $450,000 last year showed no significant improvement. Account executives who sold between $350,000 and $450,000 last year performed worse this year. Account executives who sold above $450,000 last year showed considerable improvement. Account executives who sold above $450,000 last year showed no significant improvement. Account executives who sold above $450,000 last year performed worse this year. Sales Management I: At the very beginning of the current sales year, all account executives (i.e., sales personnel) completed an extensive sales training program. Now, at the end of the sales year, the Director of Enterprise Sales has recorded annual sales figures for all account executives for this year and last year across three different regions and created the following gra For each graphic, choose the best descriptors (Select all that apply.). (HINT: Select one or more of the cholces below each graphic). (a) The graphic below summarizes sales figures for Region A. (Select all that apply.) Scatterplot of This Year's Annual Sales vs. Last Year's All account executives have shown significant improvement in sales performance this year compared to last year (presumably due to the training). The training was no help. Each account executive's sales performance this year was about the same as his/her performance last year. The training further confused/hindered the account executives. All account executives decreased in their performance this year compared to last year. Account executives who sold below $350,000 last year showed considerable improvement. Account executives who sold below $350,000 last year showed no significant improvement. Account executlves who sold below $350,000 last year performed worse this year. Account executives who sold between $350,000 and $450,000 last year showed considerable improvement. Account executives who sold between $350,000 and $450,000 last year showed no significant improvement. Account executives who sold between $350,000 and $450,000 last year performed worse this year. Account executives who sold above $450,000 last year showed considerable improvement. Account executives who sold above $450,000 last year showed no significant improvement. Account executives who sold above $450,000 last year performed worse this year. (b) The graphic below summarizes sales figures for Region B. (Select all that apply.) Scatterplot of This Year's Annual Sales vs. Last Year's All account executives have shown significant improvement in sales performance this year compared to last year (presumably due to the training). The training was no help. Each account executive's sales performance this year was about the same as his/her performance last year. The training further confused/hindered the account executives. All account executives decreased in their performance this year compared to last year. Account executives who sold below $350,000 last year showed considerable improvement. Account executives who sold below $350,000 last year showed no signifleant improvement. Account executives who sold below $350,000 last year performed worse this year. Account executives who sold between $350,000 and $450,000 last year showed considerable improvement. Account executives who sold between $350,000 and $450,000 last year showed no significant improvement. Account executives who sold between $350,000 and $450,000 last year performed worse this year. Account executives who sold above $450,000 last year showed considerable improvement. Account executives who sold above $450,000 last year showed no significant improvement. Account executives who sold above $450,000 last year performed worse this year. (c) The graphic below summarizes sales figures for Region C. (Select all that apply.) Scatterplot of This Year's Annual Sales vs. Last Year's All account executives have shown significant improvement in sales performance this year compared to last year (presumably due to the training). The training was no help. Each account executive's sales performance this year was about the same as his/her performance last year. The training further confused/hindered the account executives. All account executives decreased in their performance this year compared to last year. Account executives who sold below $350,000 last year showed considerable improvement. Account executives who sold below $350,000 last year showed no significant improvement. Account executives who sold below $350,000 last year performed worse this year. Account executives who sold between $350,000 and $450,000 last year showed considerable improvement. Account executives who sold between $350,000 and $450,000 last year showed no significant improvement. Account executives who sold between $350,000 and $450,000 last year performed worse this year. Account executives who sold above $450,000 last year showed considerable improvement. Account executives who sold above $450,000 last year showed no significant improvement. Account executives who sold above $450,000 last year performed worse this year