Question
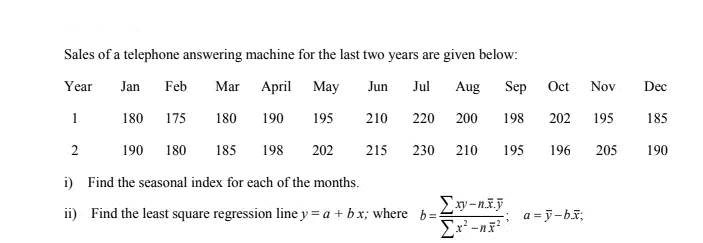
iii) Using the regression line found in ii) determine 3rd year demand. iv) Forecast the rounded-off monthly demand for each of the months of the
 iii) Using the regression line found in
ii) determine 3rd year demand.
iv) Forecast the rounded-off monthly demand for each of the months of the third year.
Sales of a telephone answering machine for the last two years are given below: Year Jan Feb Mar April May Jun Jul Aug Sep 210 220 1 180 175 180 190 195 2 190 180 185 198 202 215 230 i) Find the seasonal index for each of the months. ii) Find the least square regression line y = a + bx; where b Oct Nov 200 198 202 195 185 210 195 196 205 xy-n.xy ;a=y-bx; x-x Dec 190
Step by Step Solution
3.53 Rating (163 Votes )
There are 3 Steps involved in it
Step: 1
i Seasonal Index for Months Jan Feb Mar Apr May Jun Jul Aug Sep Oct Nov Dec 175 180 ...
Get Instant Access to Expert-Tailored Solutions
See step-by-step solutions with expert insights and AI powered tools for academic success
Step: 2

Step: 3

Ace Your Homework with AI
Get the answers you need in no time with our AI-driven, step-by-step assistance
Get StartedRecommended Textbook for
Microeconomics
Authors: Paul Krugman, Robin Wells
3rd edition
978-1429283427, 1429283424, 978-1464104213, 1464104212, 978-1429283434
Students also viewed these Mathematics questions
Question
Answered: 1 week ago
Question
Answered: 1 week ago
Question
Answered: 1 week ago
Question
Answered: 1 week ago
Question
Answered: 1 week ago
Question
Answered: 1 week ago
Question
Answered: 1 week ago
Question
Answered: 1 week ago
Question
Answered: 1 week ago
Question
Answered: 1 week ago
Question
Answered: 1 week ago
Question
Answered: 1 week ago
Question
Answered: 1 week ago
Question
Answered: 1 week ago
Question
Answered: 1 week ago
Question
Answered: 1 week ago
Question
Answered: 1 week ago
Question
Answered: 1 week ago
Question
Answered: 1 week ago
Question
Answered: 1 week ago
View Answer in SolutionInn App


