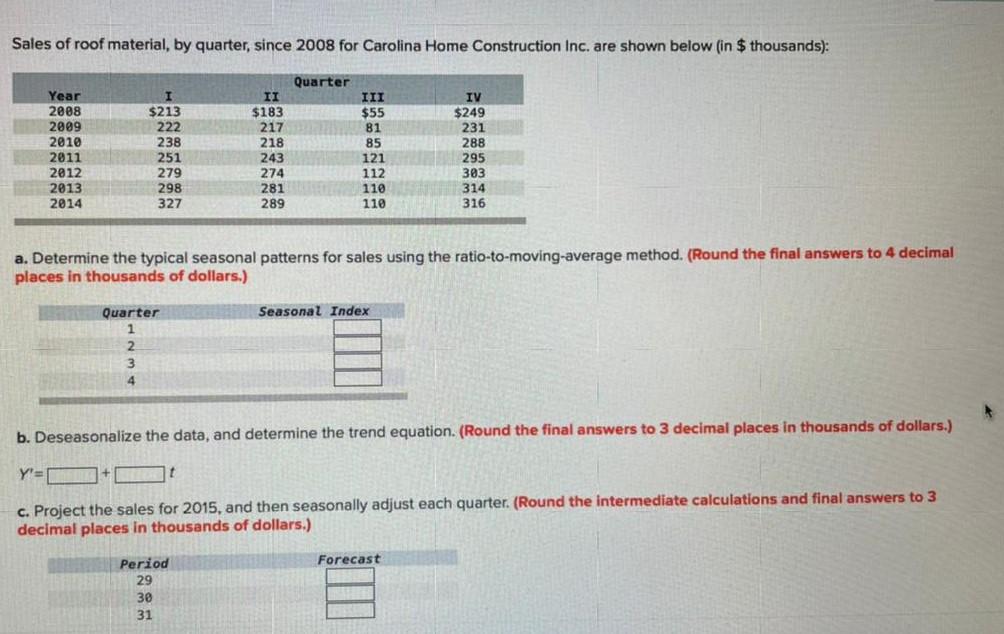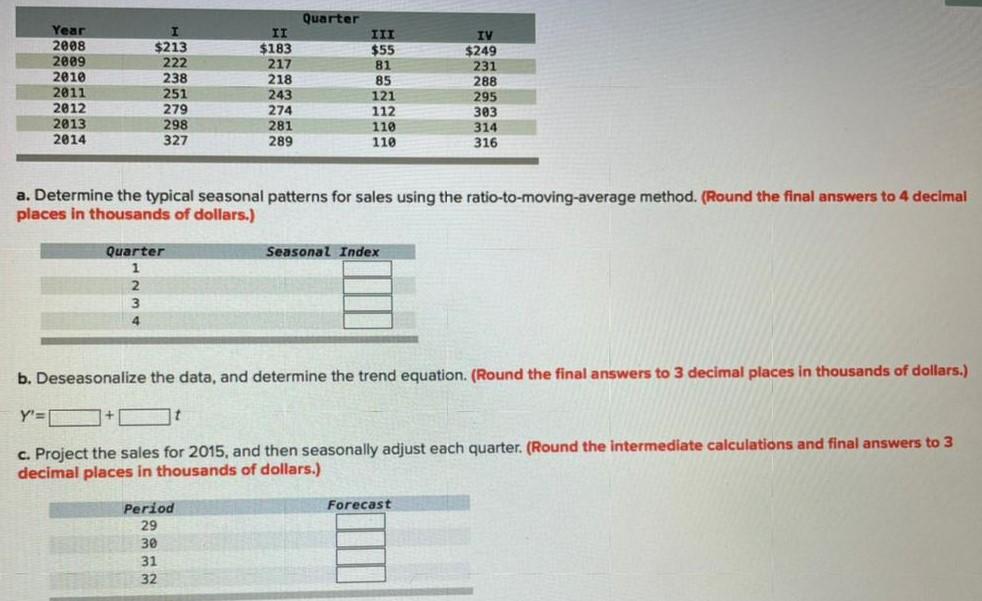

Sales of roof material, by quarter, since 2008 for Carolina Home Construction Inc. are shown below (in $ thousands): IV $249 Year 2008 2009 2010 2011 2012 2013 2014 $213 222 238 251 279 298 327 Quarter II $183 217 218 243 274 281 289 III $55 81 85 121 112 110 110 231 288 295 303 314 316 a. Determine the typical seasonal patterns for sales using the ratio-to-moving-average method. (Round the final answers to 4 decimal places in thousands of dollars.) Seasonal Index Quarter 1 2 2. 3 4 b. Deseasonalize the data, and determine the trend equation. (Round the final answers to 3 decimal places in thousands of dollars.) Y'=t O c. Project the sales for 2015, and then seasonally adjust each quarter. (Round the intermediate calculations and final answers to 3 decimal places in thousands of dollars.) Forecast Period 29 30 31 Quarter Year 2008 2009 2010 2011 2012 2013 2014 $213 222 238 251 279 298 327 II $183 217 218 243 274 281 289 III $55 81 85 121 112 110 110 IV $249 231 288 295 303 314 316 a. Determine the typical seasonal patterns for sales using the ratio-to-moving average method. (Round the final answers to 4 decimal places in thousands of dollars.) Seasonal Index Quarter 1 2 3 4 b. Deseasonalize the data, and determine the trend equation. (Round the final answers to 3 decimal places in thousands of dollars.) Y'= c. Project the sales for 2015, and then seasonally adjust each quarter. (Round the intermediate calculations and final answers to 3 decimal places in thousands of dollars.) Forecast Period 29 30 31 32 Sales of roof material, by quarter, since 2008 for Carolina Home Construction Inc. are shown below (in $ thousands): IV $249 Year 2008 2009 2010 2011 2012 2013 2014 $213 222 238 251 279 298 327 Quarter II $183 217 218 243 274 281 289 III $55 81 85 121 112 110 110 231 288 295 303 314 316 a. Determine the typical seasonal patterns for sales using the ratio-to-moving-average method. (Round the final answers to 4 decimal places in thousands of dollars.) Seasonal Index Quarter 1 2 2. 3 4 b. Deseasonalize the data, and determine the trend equation. (Round the final answers to 3 decimal places in thousands of dollars.) Y'=t O c. Project the sales for 2015, and then seasonally adjust each quarter. (Round the intermediate calculations and final answers to 3 decimal places in thousands of dollars.) Forecast Period 29 30 31 Quarter Year 2008 2009 2010 2011 2012 2013 2014 $213 222 238 251 279 298 327 II $183 217 218 243 274 281 289 III $55 81 85 121 112 110 110 IV $249 231 288 295 303 314 316 a. Determine the typical seasonal patterns for sales using the ratio-to-moving average method. (Round the final answers to 4 decimal places in thousands of dollars.) Seasonal Index Quarter 1 2 3 4 b. Deseasonalize the data, and determine the trend equation. (Round the final answers to 3 decimal places in thousands of dollars.) Y'= c. Project the sales for 2015, and then seasonally adjust each quarter. (Round the intermediate calculations and final answers to 3 decimal places in thousands of dollars.) Forecast Period 29 30 31 32


