Same picture same problem. Just Incase it was hard to read. Thank you for your time
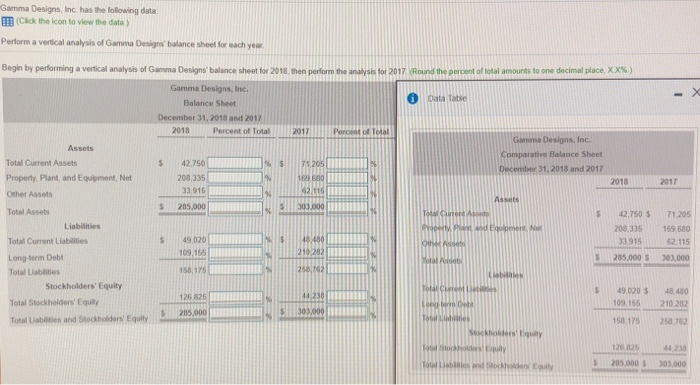
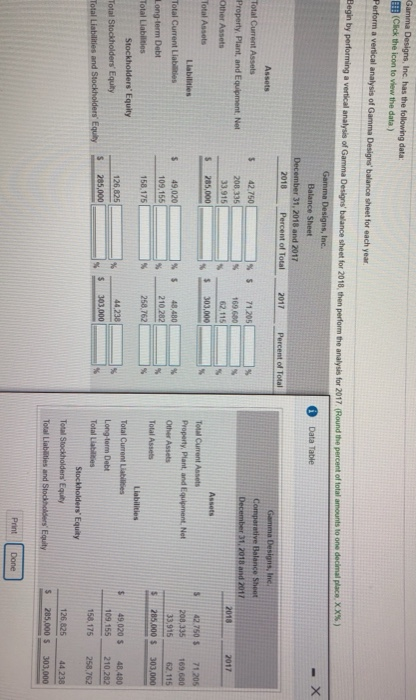
Gamma Designs, Inc has the following data (Cick the icon to view the data) Perform a vertical analysis of Gamma Designs balance sheet for each year Begin by performing a vertical analysis of Ga na Designs balance sheet for 201 Begin by performing a vertical analysis of Gamma Designs balance sheet for 2018,then perform the anayss for 2017 Round the percent of total amounts to one decimal place.Xx%. then pe form the analysis l r 2017 Rand the percent attal am ures to one deci i place XX% Gamma Designs, Inc. Balance Sheet December 31,2018 and 2017 Oata tabie 2018Percent of TotalI 2017 Porceet of Total Garnma Designs Inc. Comparative Balance Sheet December 31, 2018 and 2017 Assets Total Current Assets Property. Plant, and Equipment, Net Other Assets Total Assebs 42.750 208,335 3 915 285,000 1.205 2018 2017 62.115 S303.000 S 42,750 71.20 Liabilities aod Equpenent. Net S49.020 109 155 208.335 169 680 3,91562115 S 285,000 303,000 Current Liabilities Long term Debir Total Liabilities 158,175 Stockholders Equity Total C 49,020 48.480 126 825 44,23 Total Stockholders' Equit 109 15 210 282 150 176 258 762 12002544 230 s205,000 5113032000 285.000 303,000 sheet for 2018, then perform the analysis for 2017 Round the percent of total amounts to one decimal place x x% ) Designs, Inc. Balance Sheet Data Table 31, 2018 and 2017 t of Total 2017 Assets Comparative Balance Sheet s 42.750 208.335 33,915 S 285,000 %S 71.205 169 680 62.115 303,000 Property, Plant, and Equipment, Net Assets Total Current Anset Property, Plant,and Equipment, Net Other Assets Total Assels S42.750 5 71205 200,335169 680 33915 62 115 S285,000 $ 303,000 otal Assets Liabilities %$ 48,480 210 282 49,020 109,155 158 175 Total Current Liabilities % 258,762 Liabilities Total Current Liabilities Long -term Debt s49 020 S 48,480 109,155 210.282 126,825 44.238 303,000 S 285,000 158.175 258.762 Stockholders Equity Total Stockholders Equity 26.825 44 238 285,000 $ 303,000