

Answered step by step
Verified Expert Solution
Question
1 Approved Answer
sample of subjects with high lead levels in their blood were collected. The statistics are summarized in the accompanying table. Assume that the two
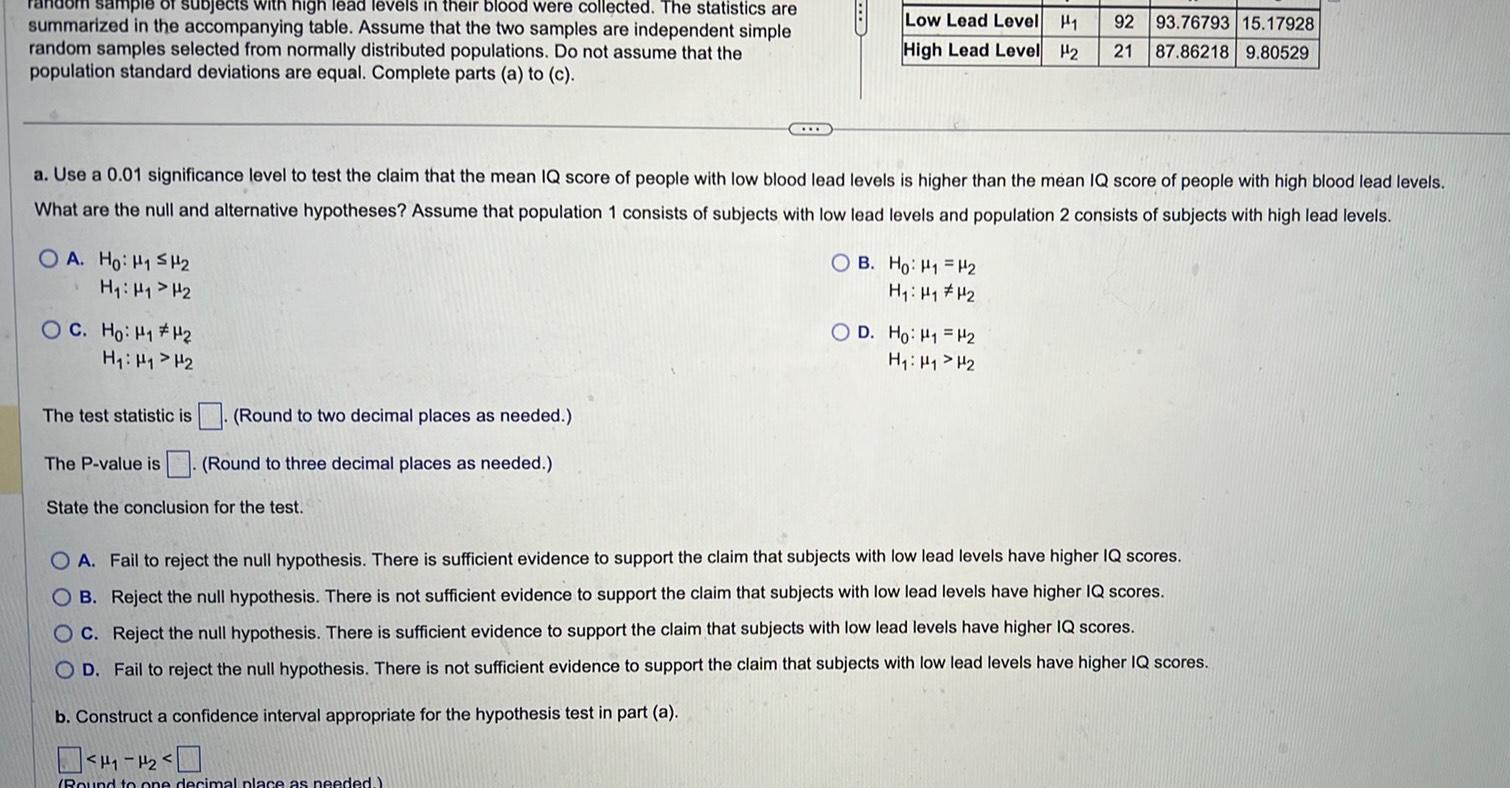
sample of subjects with high lead levels in their blood were collected. The statistics are summarized in the accompanying table. Assume that the two samples are independent simple random samples selected from normally distributed populations. Do not assume that the population standard deviations are equal. Complete parts (a) to (c). Low Lead Level High Lead Level 2 1 92 93.76793 15.17928 21 87.86218 9.80529 a. Use a 0.01 significance level to test the claim that the mean IQ score of people with low blood lead levels is higher than the mean IQ score of people with high blood lead levels. What are the null and alternative hypotheses? Assume that population 1 consists of subjects with low lead levels and population 2 consists of subjects with high lead levels. OA. Ho: H1 H2 H: H1 H2 OB. Ho: H H: H1 H2 The test statistic is (Round to two decimal places as needed.) The P-value is (Round to three decimal places as needed.) OD. Ha H H: H1 H2 State the conclusion for the test. OA. Fail to reject the null hypothesis. There is sufficient evidence to support the claim that subjects with low lead levels have higher IQ scores. OB. Reject the null hypothesis. There is not sufficient evidence to support the claim that subjects with low lead levels have higher IQ scores. OC. Reject the null hypothesis. There is sufficient evidence to support the claim that subjects with low lead levels have higher IQ scores. OD. Fail to reject the null hypothesis. There is not sufficient evidence to support the claim that subjects with low lead levels have higher IQ scores. b. Construct a confidence interval appropriate for the hypothesis test in part (a). < < Bound to one decimal place as needed.)
Step by Step Solution
There are 3 Steps involved in it
Step: 1

Get Instant Access to Expert-Tailored Solutions
See step-by-step solutions with expert insights and AI powered tools for academic success
Step: 2

Step: 3
Ace Your Homework with AI
Get the answers you need in no time with our AI-driven, step-by-step assistance
Get Started
Forecasting Time Series And Regression
Authors: Bruce L. Bowerman, Richard O'Connell, Anne Koehler
4th Edition
0534409776, 9780534409777