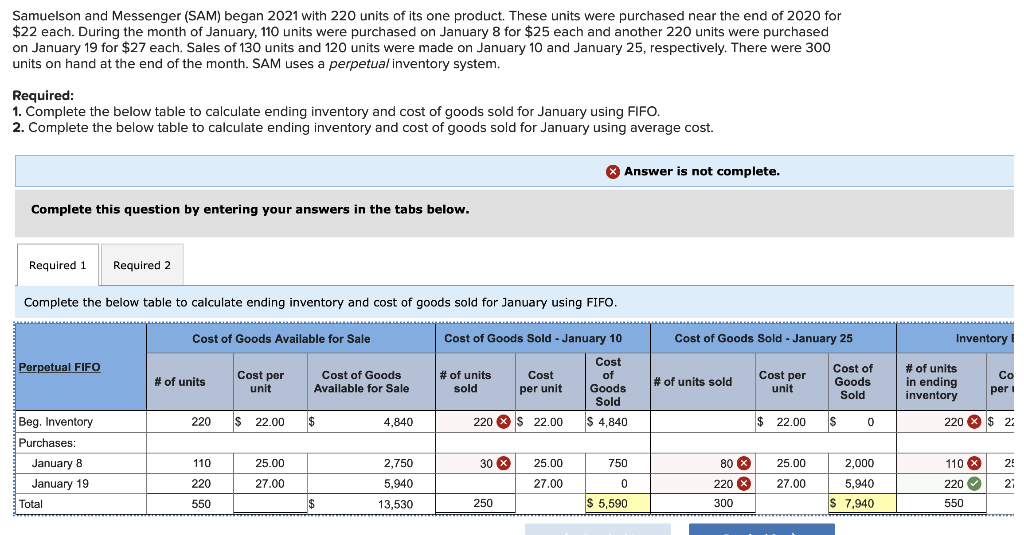
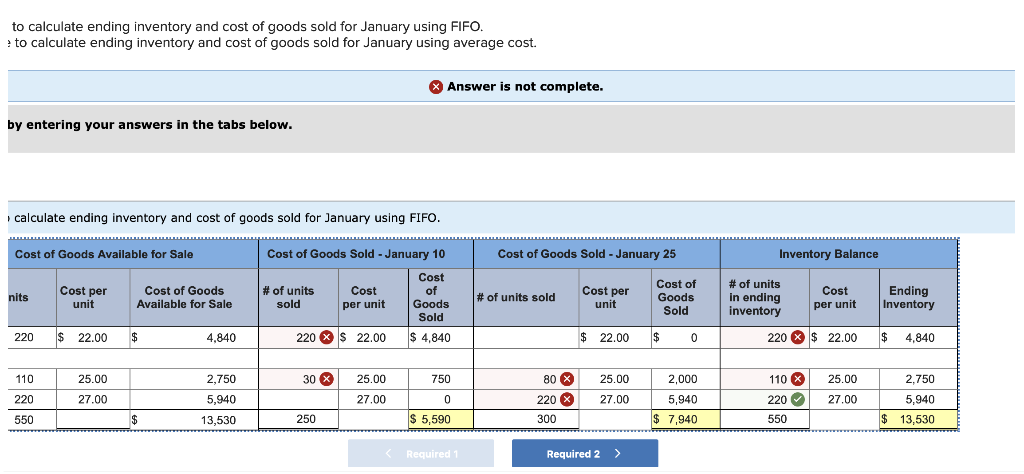
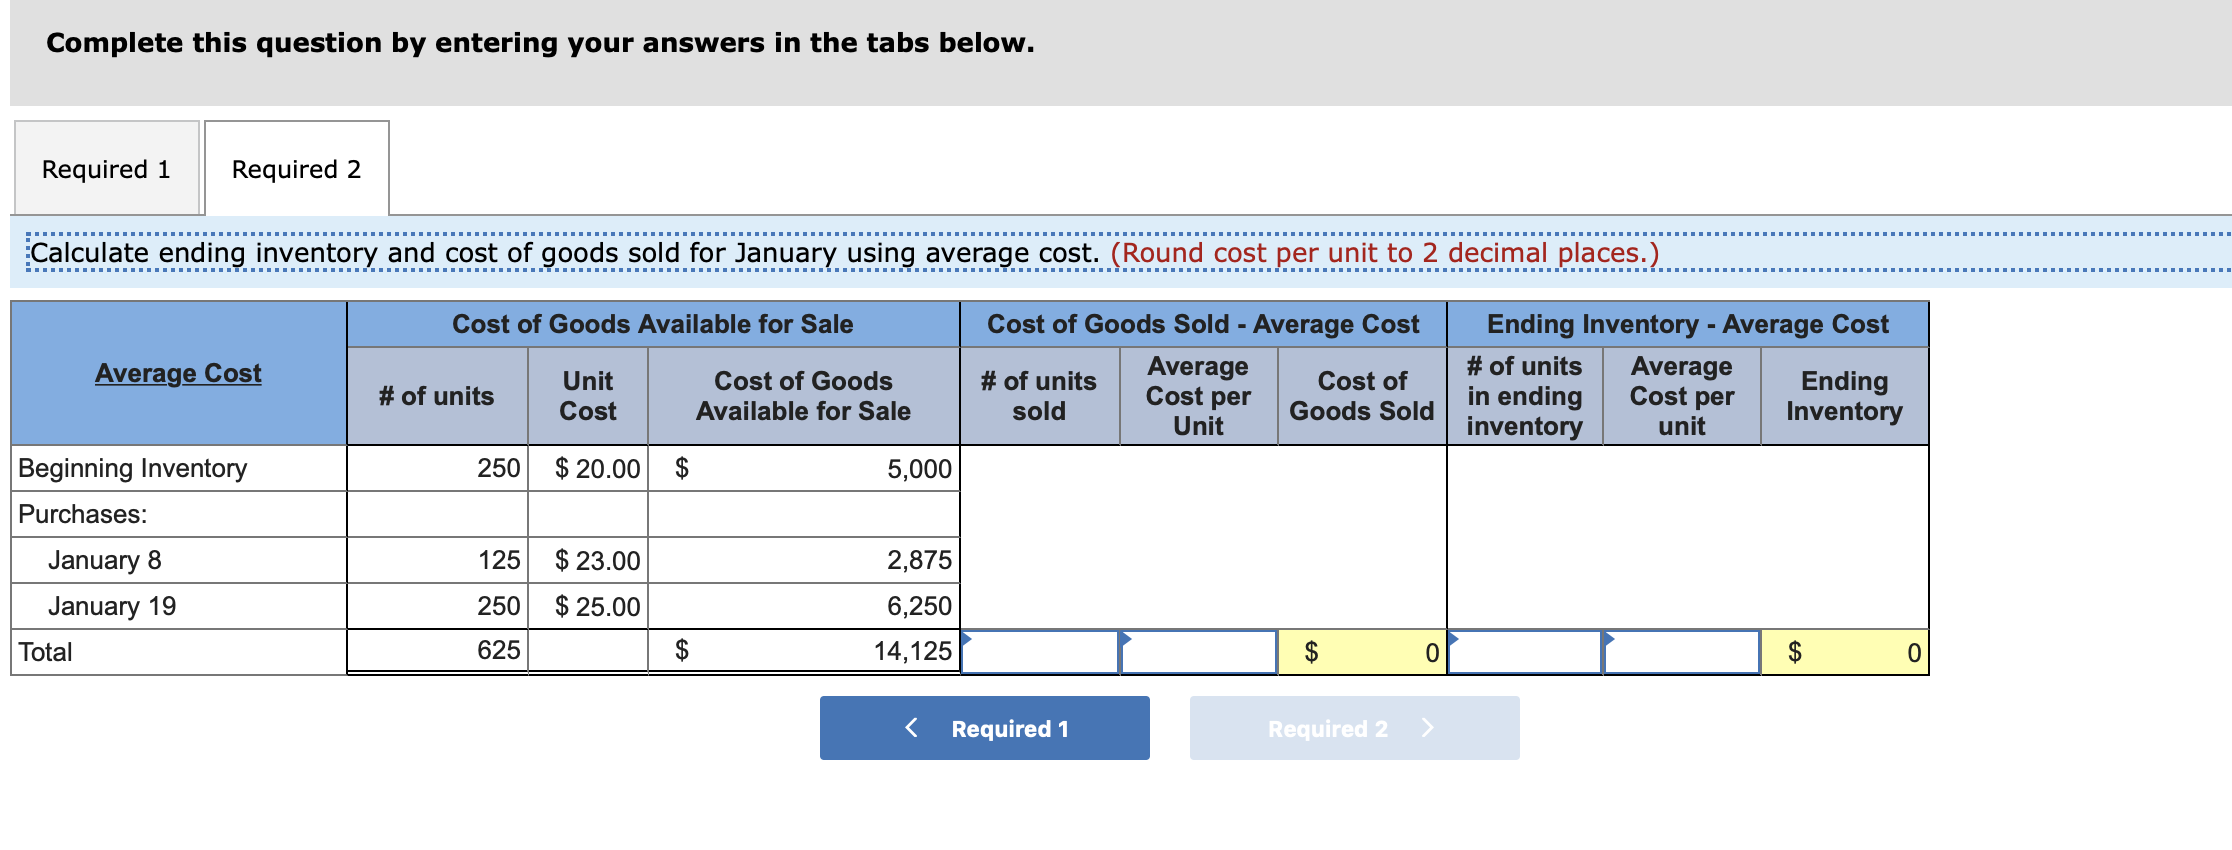
Samuelson and Messenger (SAM) began 2021 with 220 units of its one product. These units were purchased near the end of 2020 for $22 each. During the month of January, 110 units were purchased on January 8 for $25 each and another 220 units were purchased on January 19 for $27 each. Sales of 130 units and 120 units were made on January 10 and January 25, respectively. There were 300 units on hand at the end of the month. SAM uses a perpetual inventory system. Required: 1. Complete the below table to calculate ending inventory and cost of goods sold for January using FIFO. 2. Complete the below table to calculate ending inventory and cost of goods sold for January using average cost. Answer is not complete. Complete this question by entering your answers in the tabs below. Required 1 Required 2 Complete the below table to calculate ending inventory and cost of goods sold for January using FIFO. Cost of Goods Available for Sale Cost of Goods Sold - January 25 Inventory! Perpetual FIFO Cost per Cost per # # of units Cost of Goods Sold - January 10 Cost # of units Cost of sold per unit Goods Sold 220 X $ 22.00 $ 4,840 Cost of Goods Available for Sale # of units sold Cost of Goods Sold unit # of units in ending inventory unit Co per Beg. Inventory 220 $ 22.00 $ 4,840 $ 22.00 IS 0 220 X $ 2 Purchases: 110 25.00 2,750 30 X 25.00 750 80 X 25.00 110 X 2: January 8 January 19 Total 2,000 5,940 220 27.00 5,940 27.00 0 27.00 220 21 220 X 300 550 $ 13,530 250 $ 5,590 Free S 7,940 550 to calculate ending inventory and cost of goods sold for January using FIFO. ? to calculate ending inventory and cost of goods sold for January using average cost. Answer is not complete. by entering your answers in the tabs below. calculate ending inventory and cost of goods sold for January using FIFO. Cost of Goods Available for Sale Cost of Goods Sold - January 10 Cost of Goods Sold - January 25 Inventory Balance nits Cost per unit Cost of Goods Available for Sale # of units sold Cost per unit Cost of Goods Sold # of units sold Cost per unit Cost of Goods Sold # of units in ending inventory Cost per unit Ending Inventory 220 $ 22.00 $ 4,840 220 X $ 22.00 $ 4,840 $ 22.00 $ 0 220 $ 22.00 $ 4,840 110 25.00 30 x 25.00 750 80 X 2,000 110 X 25.00 2,750 5,940 25.00 27.00 220 27.00 27.00 0 220 X 5,940 220 27.00 2.750 5,940 $ 13,530 550 $ 13,530 250 $ 5,590 300 $ 7,940 550 Required 1 Required 2 > Complete this question by entering your answers in the tabs below. Required 1 Required 2 Calculate ending inventory and cost of goods sold for January using average cost. (Round cost per unit to 2 decimal places.) Cost of Goods Available for Sale Average Cost Unit Cost Cost of Goods Sold - Average Cost Average # of units Cost of sold Goods Sold Unit Cost of Goods Available for Sale # of units Ending Inventory - Average Cost # of units Average Ending in ending inventory Inventory unit Cost per Cost per Beginning Inventory 250 $ 20.00 $ 5,000 Purchases: 125 $ 23.00 2,875 January 8 January 19 250 $ 25.00 6,250 Total 625 $ 14,125 $ 0 $ 0 Required 1 Required 2