

Answered step by step
Verified Expert Solution
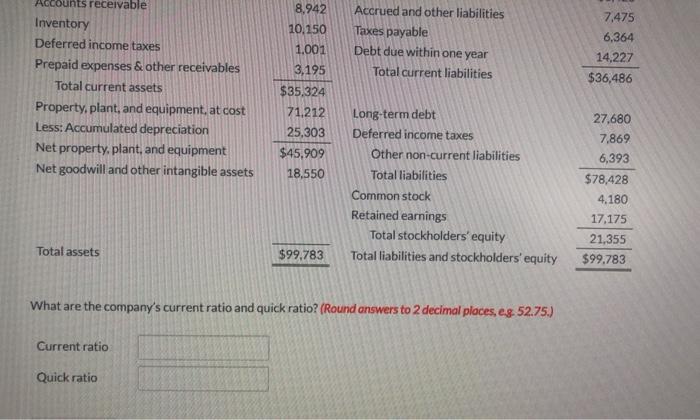
Question
1 Approved Answer
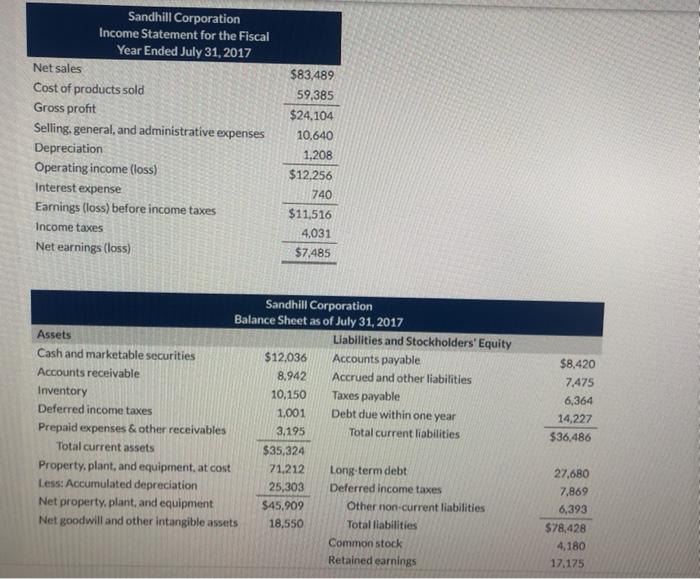
Sandhill Corporation Income Statement for the Fiscal Year Ended July 31, 2017 Net sales Cost of products sold Gross profit Selling, general, and administrative expenses
Step by Step Solution
There are 3 Steps involved in it
Step: 1

Get Instant Access to Expert-Tailored Solutions
See step-by-step solutions with expert insights and AI powered tools for academic success
Step: 2

Step: 3
Ace Your Homework with AI
Get the answers you need in no time with our AI-driven, step-by-step assistance
Get Started
Practical financial management
Authors: William r. Lasher
5th Edition
0324422636, 978-0324422634