

Answered step by step
Verified Expert Solution
Question
1 Approved Answer
SAS 3 : Inputting data manually for Odds Ratios and Relative Risk Last week, you learned how to read an excel file into SAS. There
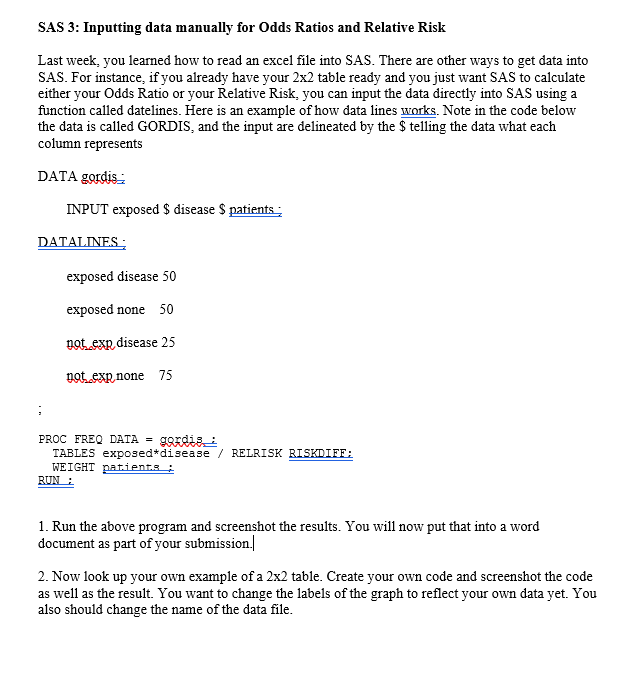
SAS : Inputting data manually for Odds Ratios and Relative Risk
Last week, you learned how to read an excel file into SAS. There are other ways to get data into
SAS. For instance, if you already have your table ready and you just want SAS to calculate
either your Odds Ratio or your Relative Risk, you can input the data directly into SAS using a
function called datelines. Here is an example of how data lines warks. Note in the code below
the data is called GORDIS, and the input are delineated by the $ telling the data what each
column represents
DATA gordis:
INPUT exposed $ disease $ patients:
DATALINES:
exposed disease
exposed none
notexp disease
notexp none
;
PROC FREQ DATA gQrdis:
TABLES exposeddisease RELRISK RISKDIEE:
WEIGHT patient.s:
RUN :
Run the above program and screenshot the results. You will now put that into a word
document as part of your submission.
Now look up your own example of a table. Create your own code and screenshot the code
as well as the result. You want to change the labels of the graph to reflect your own data yet. You
also should change the name of the data file.
Step by Step Solution
There are 3 Steps involved in it
Step: 1

Get Instant Access to Expert-Tailored Solutions
See step-by-step solutions with expert insights and AI powered tools for academic success
Step: 2

Step: 3
Ace Your Homework with AI
Get the answers you need in no time with our AI-driven, step-by-step assistance
Get Started
Oracle Database 10g Insider Solutions
Authors: Arun R. Kumar, John Kanagaraj, Richard Stroupe
1st Edition
0672327910, 978-0672327919