

Answered step by step
Verified Expert Solution
Question
1 Approved Answer
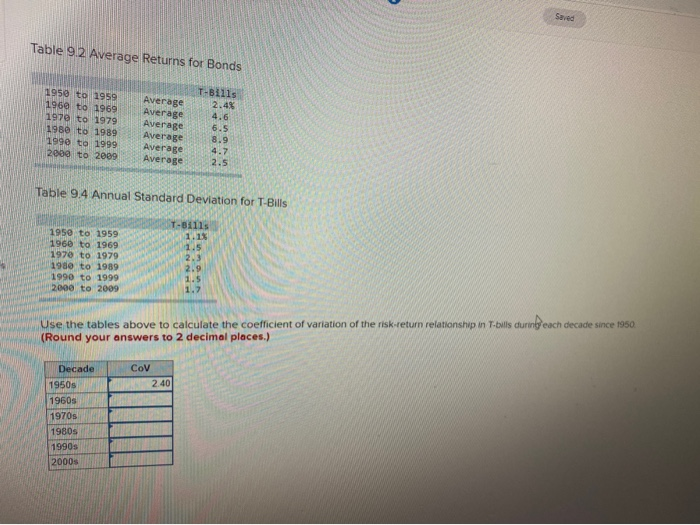
Saved Table 9.2 Average Returns for Bonds 1950 to 1959 1960 to 1969 1970 to 1979 1980 to 1989 1990 to 1999 2000 to 2009
Step by Step Solution
There are 3 Steps involved in it
Step: 1

Get Instant Access to Expert-Tailored Solutions
See step-by-step solutions with expert insights and AI powered tools for academic success
Step: 2

Step: 3
Ace Your Homework with AI
Get the answers you need in no time with our AI-driven, step-by-step assistance
Get Started
Cryptocurrency Trading Guide For Beginners
Authors: Miquel Vidal ,Joan Garcia Guerrero
1st Edition
979-8705488575