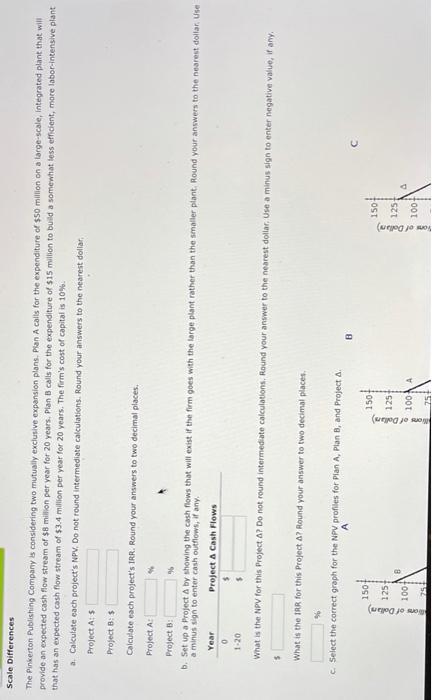
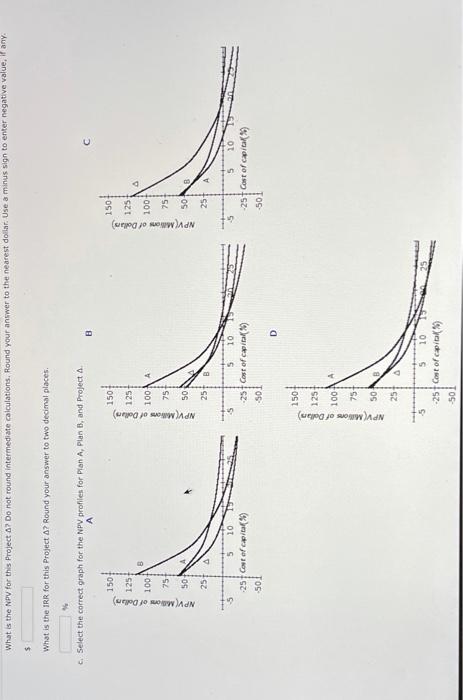
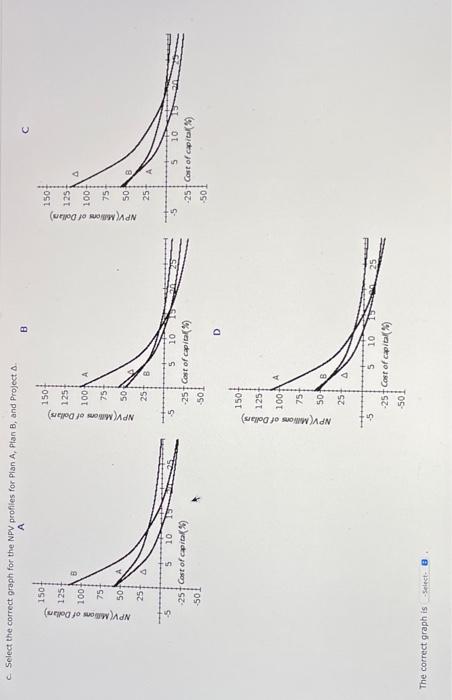
Scale Differences The Pinkerton Publishing Company is considering two mutually exclusive expansion plans. Plan A calls for the expenditure of $50 million on a large-scale integrated plant that will provide an expected cash flow stream of $8 million per year for 20 years. Plan B calls for the expenditure of $15 million to build a somewhat less efficient, more labor-intensive plant that has an expected cash flow stream of $3.4 million per year for 20 years. The firm's cost of capital is 10% a. Calcutate each project's NPV. Do not round intermediate calculations. Round your answers to the nearest dollar Project AS Project B: $ Calculate each project's TRR. Round your answers to two decimal places. Project A: Project : b. Set up a Project Aby showing the cash flows that will exist if the firm goes with the large plant rather than the smaller plant Round your answers to the nearest dollar Use a minus sign to enter cash outflows, if any. Year Project A Cash Flows 0 1-20 What is the NPV for this project A? Do not round Intermediate calculations, Round your answer to the nearest dollar, Use a minus sign to enter negative value, if any, 5 What is the IRR for this project 27 Round your answer to two decimal places Select the correct graph for the NP profiles for Pian A, Plan B, and Project A B 1501 1507 1504 125+ 125 Bow of Dollar) 125 1001 ons of dollars) 100A Yon of Dalben 100+ 25 25+ What is the NPV for this project A? Do not round intermediate calculations. Round your answer to the nearest dollar. Use a minus sign to enter negative value. If any. $ What is the IRR for this project A7 Round your answer to two decimal places Select the correct graph for the NPV profiles for Plan A, Plan B, and Project A B 150 150 125 125 125 100A NPV Millions of Dollars) 100 1007 NPV Millow of Dollars) NPV Millions of dollars 75 75+ 75 50 50 50 257 A 251 25+ A 5 5 5 10 -25 cost of capital 501 10 -25 cost of capital) -501 D 25+ Cost of capital) 501 2504 1251 100 NPV Millions of Dollar) 757 50 B 25 5 5 10 -25 Cost of of capital -501 C. Select the correct graph for the NPV profiles for Plan A, Plan B, and Project B C 150 150 150 125 125 125 6 100 NPV Millions of Dollars) 100 A NPV Millions of Dollars) 100 NPV Millions of Dollars) 75 75 757 50 50 50 25 25+ A 10 N 10 -25 cost of capita -5 5 -257 Cost of capital 10 -25+ Cost of capital sol 501 -501 D 1501 125 100 NPV Millions of Dollars) 751 50 A 14 5 10 -25 Cost of capital -501 The correct graph isSelect


