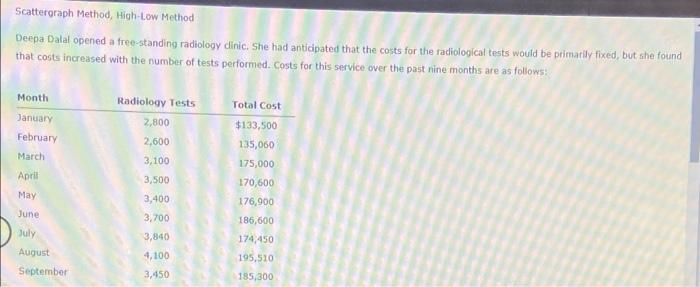
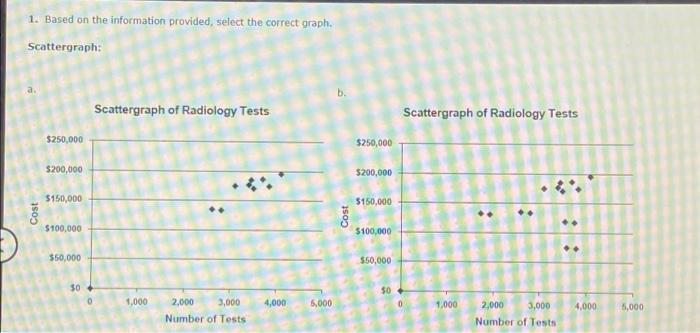
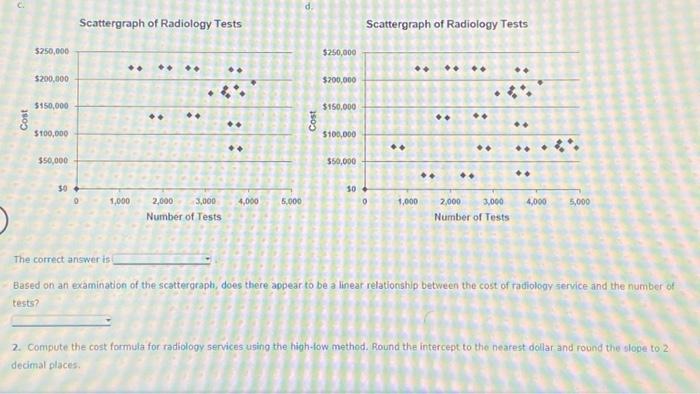
Scattergraph Method, High-Low Method Deepa Dalal opened a free-standing radiology dinic. She had anticipated that the costs for the radiological tests would be primarily fixed, but she found that costs increased with the number of tests performed. Costs for this service over the past nine months are as follows: Month Total Cost January February Radiology Tests 2,800 2,600 3,100 March $133,500 135,060 175,000 170,600 176,900 April 3,500 May 3,400 June 3,700 186,600 July 3,840 August September 4,100 3,450 174,450 195,510 185,300 1. Based on the information provided, select the correct graph. Scattergraph: b. Scattergraph of Radiology Tests Scattergraph of Radiology Tests $250,000 $250,000 $200,000 $200,000 $150,000 5150,000 Cost Cost . . $100,000 $100,000 :: $50,000 $50,000 30 $0 1,000 4,000 5.000 0 1,000 4,000 2,000 3,000 Number of Tests 5,000 2,000 3,000 Number of Tests Scattergraph of Radiology Tests Scattergraph of Radiology Tests $250,000 $250,000 .. .. .. $200,000 $200,000 5150,000 $150,000 1 > Cost Cost $100,000 :: $100,000 .. $50,000 550,000 . .. 50 10 0 1,000 4,000 5.000 0 1,000 4,000 5,000 . 2,000 3,000 Number of Tests 2.000 3,000 Number of Tests The correct answer is Based on an examination of the scattergraph, does there appear to be a linear relationship between the cost of radiology service and the number of tests? 2. Compute the cost formula for radiology services using the high-tow method. Round the intercept to the nearest dollar and round the close to 2 dedmal places K) 2. Compute the cost formula for radiology services using the high-low method. Round the intercept to the nearest dollar and round the slope to 2 decimal places. Y- 3. Calculate the predicted cost of radiology services for October for 3,500 tests using the formula found in Requirement 2. For computations, carry amounts out to two decimal places. Round your final answer to the nearest dollar