

Question
Scatterplots and Pearson correlation coefficient are good to identify relationship between two numerical features. Below is one such scatter plot. Pearson correlation came out to
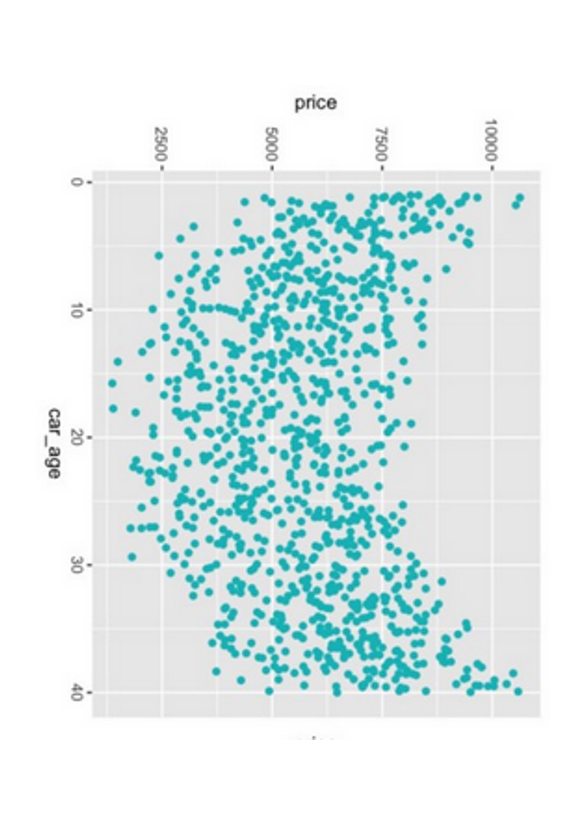
Scatterplots and Pearson correlation coefficient are good to identify relationship between two numerical features. Below is one such scatter plot. Pearson correlation came out to be very low for the data used to plot the graph. Analyst concluded there is no relationship between price and car_age.
Do you find anything wrong with the analysts interpretation? If yes, provide YOUR interpretation for the visual [2M]
What is wrong with Pearson correlation coefficient for this data? [1M]
How to identify and plot this relation-ship in Tableau .Explain[1M]
Step by Step Solution
There are 3 Steps involved in it
Step: 1

Get Instant Access to Expert-Tailored Solutions
See step-by-step solutions with expert insights and AI powered tools for academic success
Step: 2

Step: 3
Ace Your Homework with AI
Get the answers you need in no time with our AI-driven, step-by-step assistance
Get Started
Concepts of Database Management
Authors: Philip J. Pratt, Mary Z. Last
8th edition
1285427106, 978-1285427102