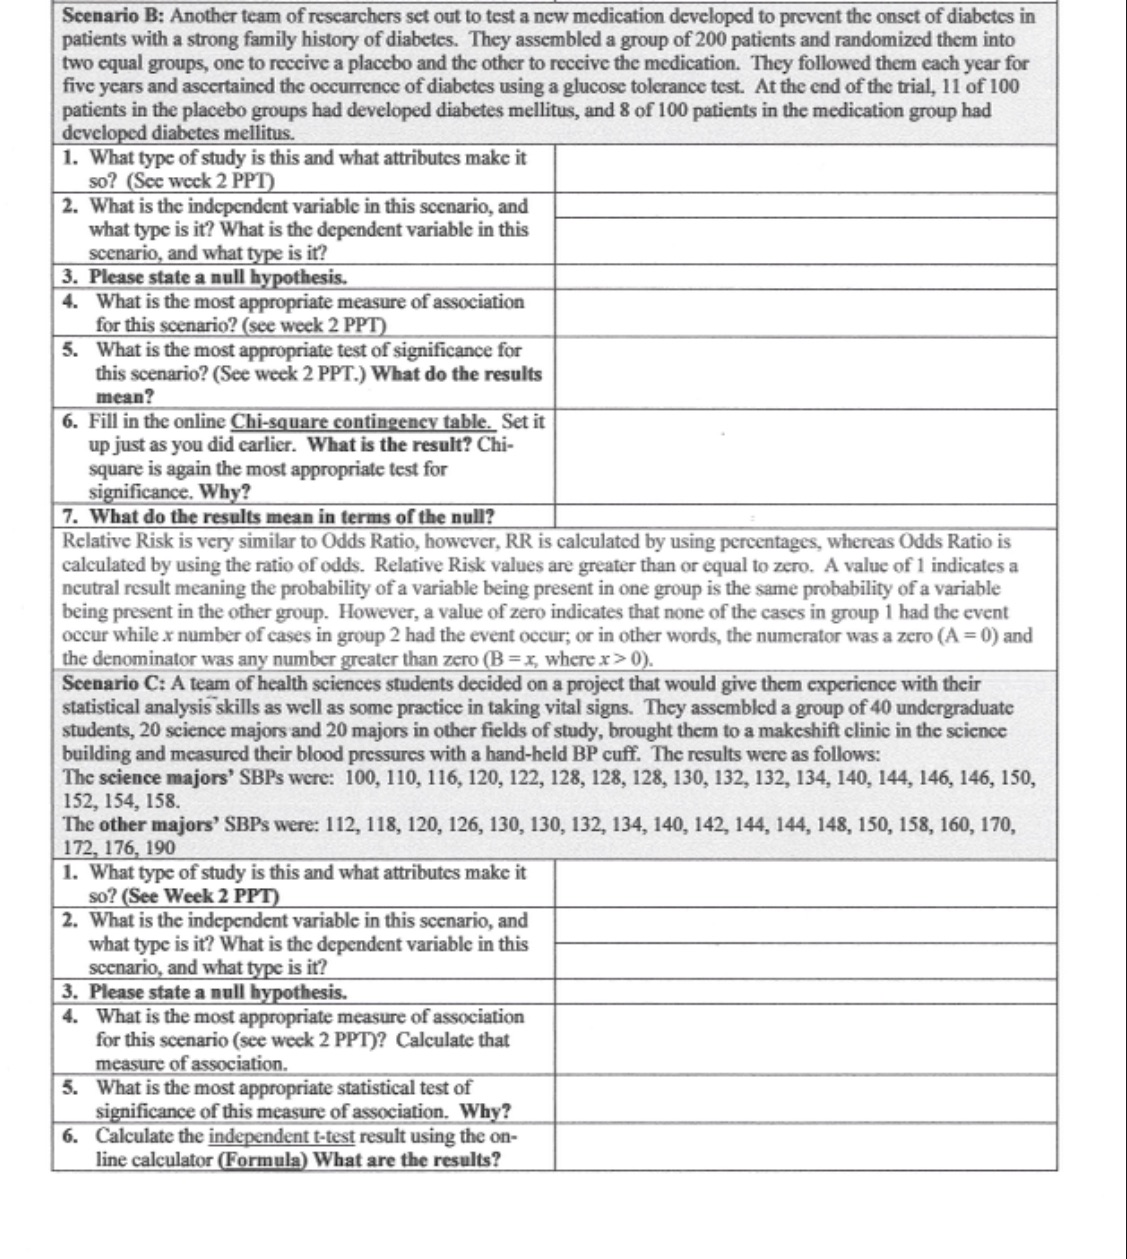
Scenario B: Another team of researchers set out to test a new medication developed to prevent the onset of diabetes in patients with a strong family history of diabetes. They assembled a group of 200 patients and randomized them into two equal groups, one to receive a placebo and the other to receive the medication. They followed them each year for five years and ascertained the occurrence of diabetes using a glucose tolerance test. At the end of the trial, 11 of 100 patients in the placebo groups had developed diabetes mellitus, and 8 of 100 patients in the medication group had developed diabetes mellitus. 1. What type of study is this and what attributes make it so? (See week 2 PPT) 2. What is the independent variable in this scenario, and what type is it? What is the dependent variable in this scenario, and what type is it? 3. Please state a null hypothesis. 4. What is the most appropriate measure of association for this scenario? (see week 2 PPT) 5. What is the most appropriate test of significance for this scenario? (See week 2 PPT.) What do the results mean? 6. Fill in the online Chi-square contingency table. Set it up just as you did earlier. What is the result? Chi- square is again the most appropriate test for significance. Why? 7. What do the results mean in terms of the null? Relative Risk is very similar to Odds Ratio, however, RR is calculated by using percentages, whereas Odds Ratio is calculated by using the ratio of odds. Relative Risk values are greater than or equal to zero. A value of 1 indicates a neutral result meaning the probability of a variable being present in one group is the same probability of a variable being present in the other group. However, a value of zero indicates that none of the cases in group 1 had the event occur while x number of cases in group 2 had the event occur; or in other words, the numerator was a zero (A = 0) and the denominator was any number greater than zero (B = x, where x > 0). Scenario C: A team of health sciences students decided on a project that would give them experience with their statistical analysis skills as well as some practice in taking vital signs. They assembled a group of 40 undergraduate students, 20 science majors and 20 majors in other fields of study, brought them to a makeshift clinic in the science building and measured their blood pressures with a hand-held BP cuff. The results were as follows: The science majors' SBPs were: 100, 110, 116, 120, 122, 128, 128, 128, 130, 132, 132, 134, 140, 144, 146, 146, 150, 152, 154, 158. The other majors' SBPs were: 112, 118, 120, 126, 130, 130, 132, 134, 140, 142, 144, 144, 148, 150, 158, 160, 170, 172, 176, 190 1. What type of study is this and what attributes make it so? (See Week 2 PPT) 2. What is the independent variable in this scenario, and what type is it? What is the dependent variable in this scenario, and what type is it? 3. Please state a null hypothesis. 4. What is the most appropriate measure of association for this scenario (see week 2 PPT)? Calculate that measure of association. 5. What is the most appropriate statistical test of significance of this measure of association. Why? 6. Calculate the independent t-test result using the on- line calculator (Formula) What are the results


