

Question
Scenario Smart businesses in all industries use data to provide an intuitive analysis of how they can get a competitive advantage. The real estate industry
Scenario
Smart businesses in all industries use data to provide an intuitive analysis of how they can get a competitive advantage. The real estate industry heavily uses linear regression to estimate home prices, as cost of housing is currently the largest expense for most families. Additionally, in order to help new homeowners and home sellers with important decisions, real estate professionals need to go beyond showing property inventory. They need to be well versed in the relationship between price, square footage, build year, location, and so many other factors that can help predict the business environment and provide the best advice to their clients.
Prompt
You have been recently hired as a junior analyst by D.M. Pan Real Estate Company. The sales team has tasked you with preparing a report that examines the relationship between the selling price of properties and their size in square feet. You have been provided with aReal Estate Data Spreadsheetspreadsheet that includes properties sold nationwide in recent years. The team has asked you to select a region, prepare initial analysis, and provide the report to the team.
Note:In the report you prepare for the sales team, the response variable (y) should be the listing price and the predictor variable (x) should be the square feet.
Specifically you must address the following rubric criteria, using theModule Two Assignment Template:
Brief overview and purpose of the report
- Generate a Representative Sample of the Data
- Select a region and generate a simple random sample of 30 from the data.
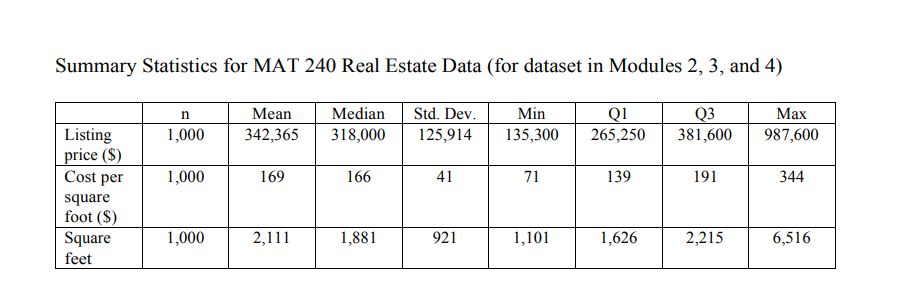
- Report the mean, median, and standard deviation of the listing price and the square foot variables.
- Analyze Your Sample
- Discuss how the regional sample created is or is not reflective of the national market.
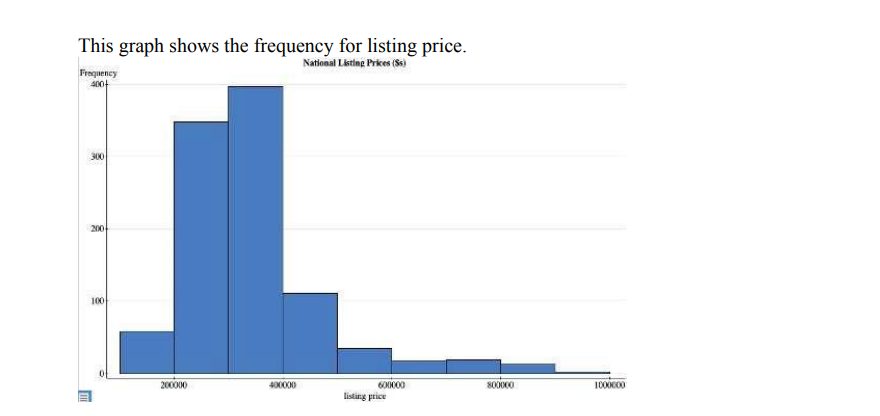
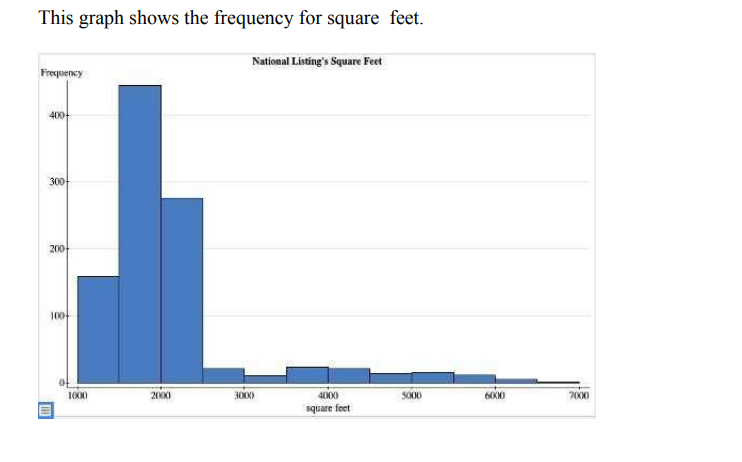
- Compare and contrast your sample with the population using theNational Summary Statistics and Graphs Real Estate Data PDFdocument.
- Explain how you have made sure that the sample is random.
- Explain your methods to get a truly random sample.
- Discuss how the regional sample created is or is not reflective of the national market.
- Generate Scatterplot
- Make a scatterplot of thexandyvariables noted above. Include a trend line and the regression equation. Label the axes.
- Observe patterns
- Answer the following questions based on the scatterplot:
- Definexandy. Which variable is useful for making predictions?
- Is there an association betweenxandy? Describe the association you see in the scatter plot.
- What do you see as the shape (linear or nonlinear)?
- If you had a 1,800 square foot house, based on the regression equation in the graph, what price would you choose to list at?
- Do you see any potential outliers in the scatterplot?
- Why do you think the outliers appeared in the scatterplot you generated?
- What do they represent?
- Answer the following questions based on the scatterplot:
You can use the following tutorial that is specifically about this assignment. Make sure to check the assignment prompt for specific numbers used for national statistics and/or square footage. The video may use different national statistics or solve for different square footage values.
https://www.youtube.com/watch?v=PCL4YbDeGvg
----
National Summary Statistics and Graphs Real Estate Data PDF
Step by Step Solution
There are 3 Steps involved in it
Step: 1

Get Instant Access to Expert-Tailored Solutions
See step-by-step solutions with expert insights and AI powered tools for academic success
Step: 2

Step: 3
Ace Your Homework with AI
Get the answers you need in no time with our AI-driven, step-by-step assistance
Get Started
A First Course in Differential Equations with Modeling Applications
Authors: Dennis G. Zill
10th edition
978-1111827052