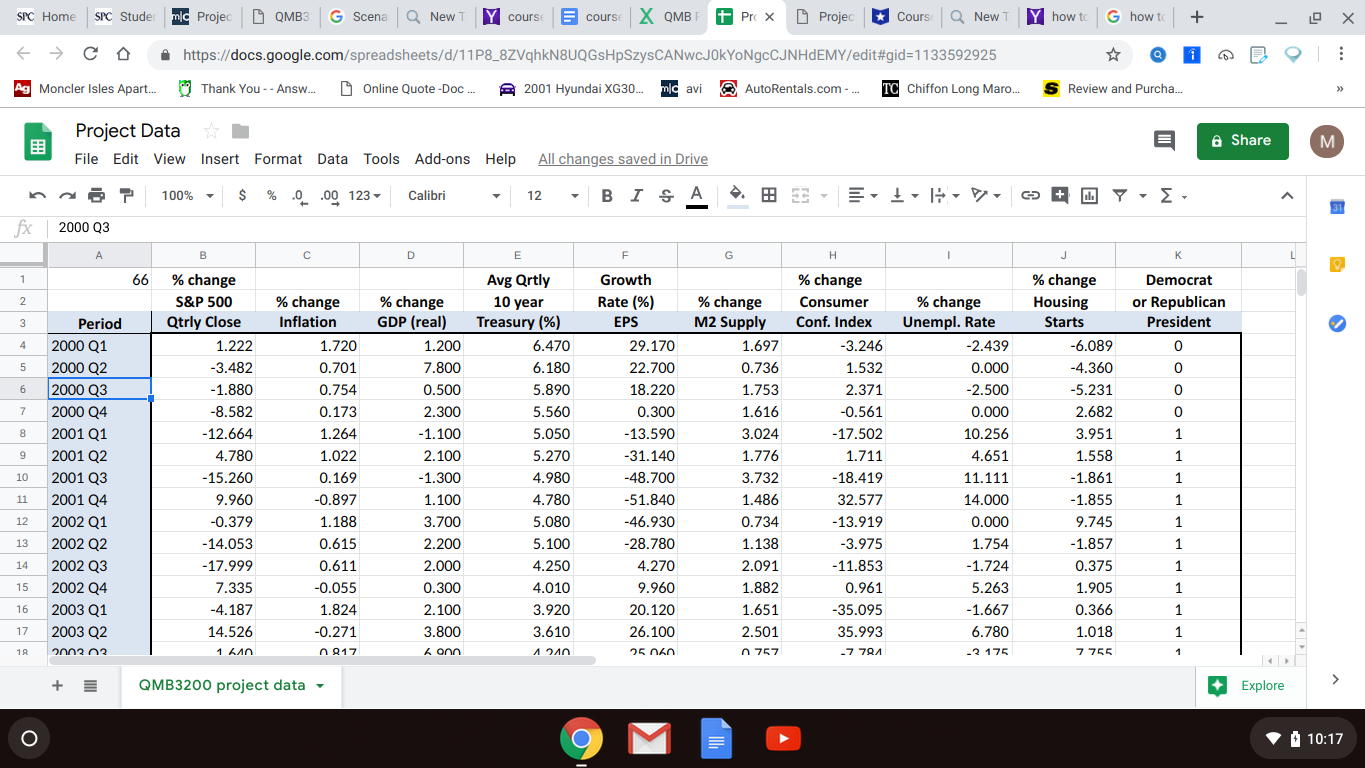
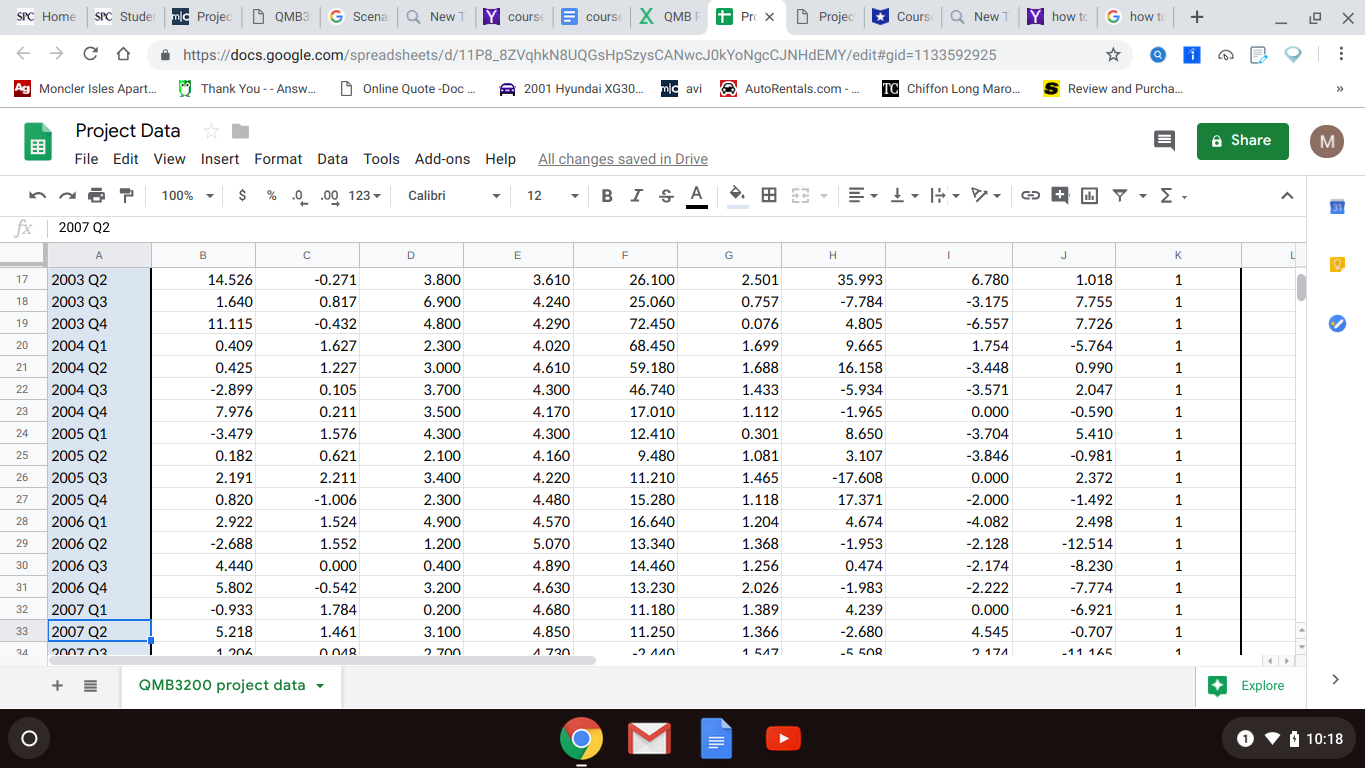
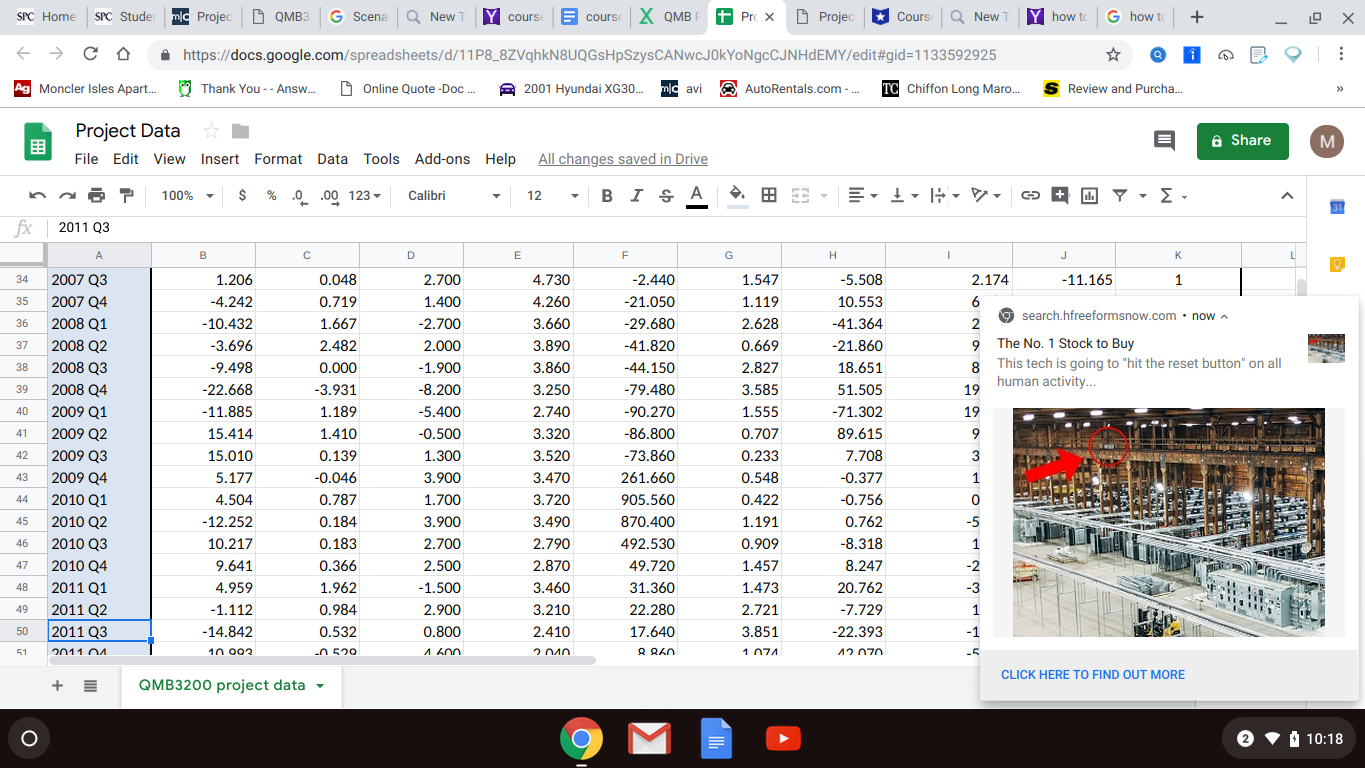
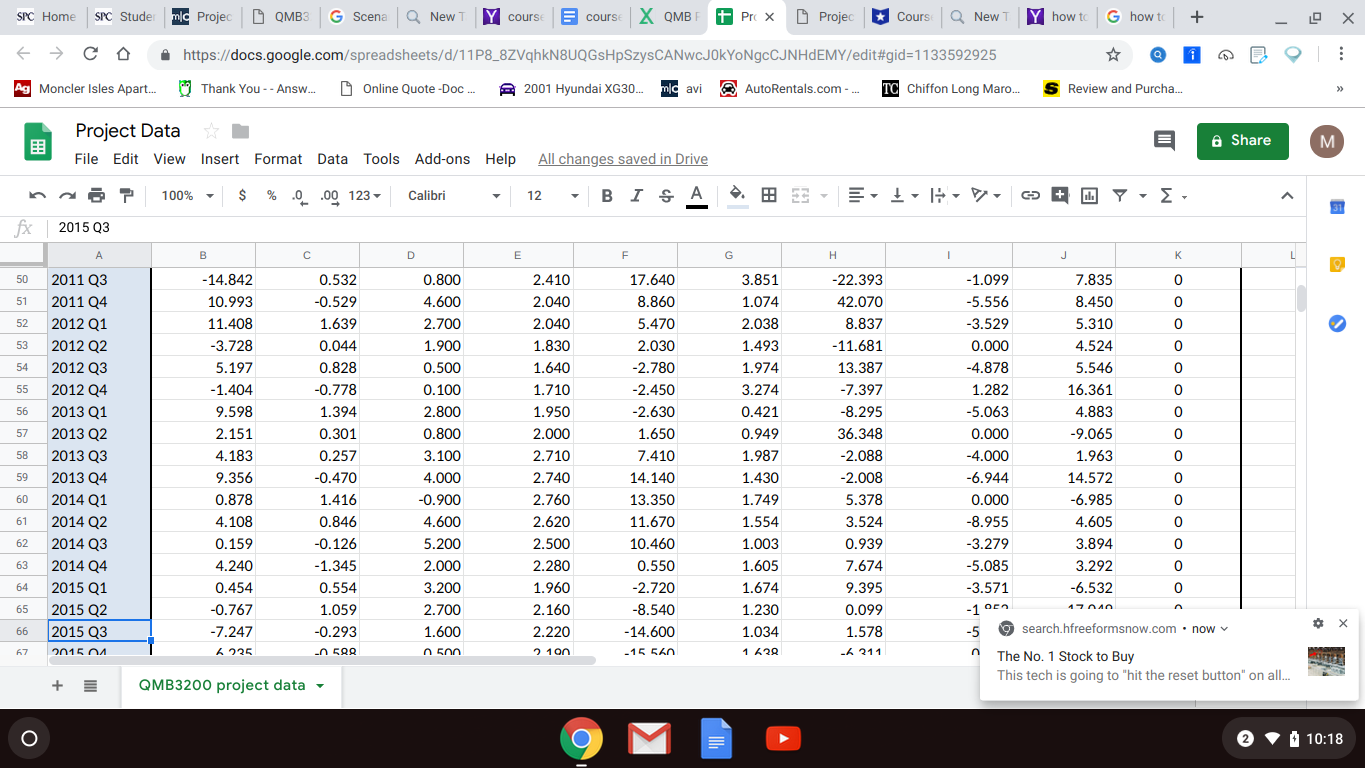
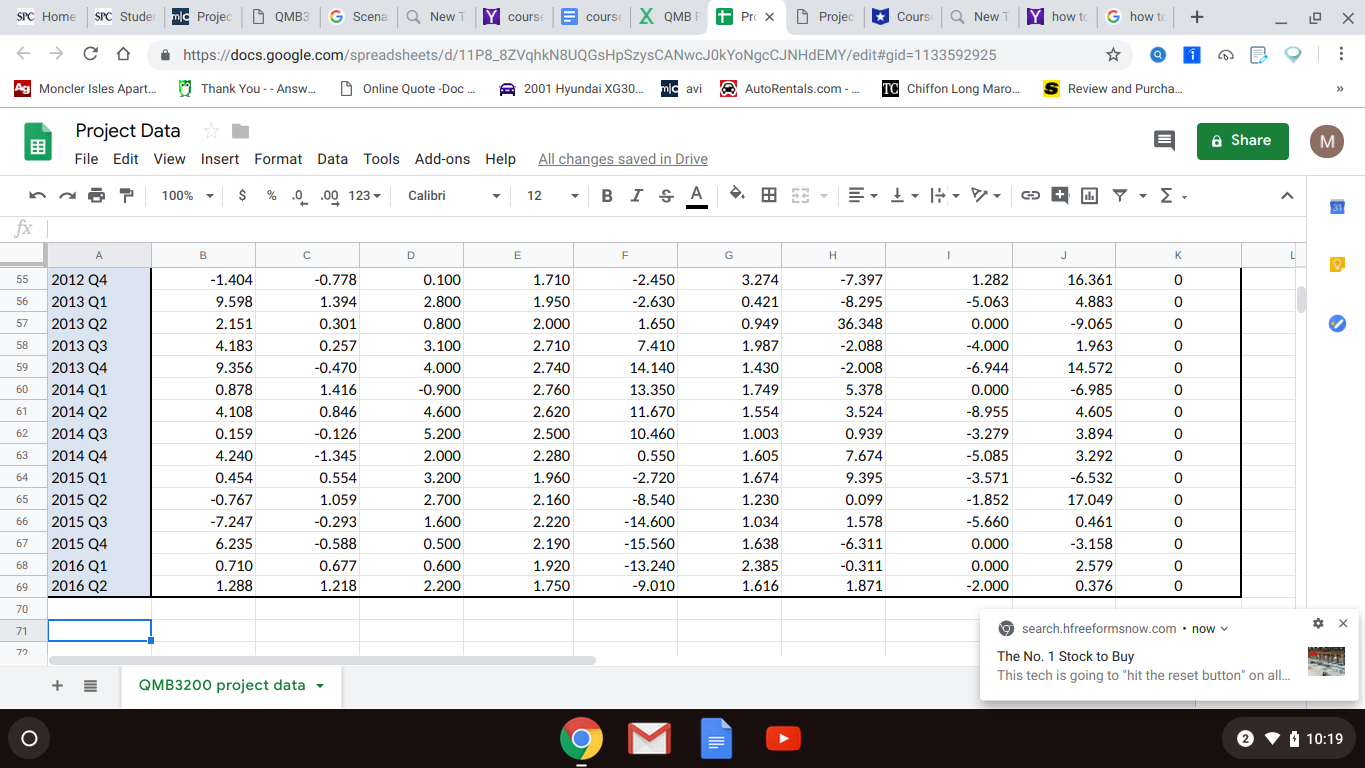
Scenario: You have put together a time-series data set that includes numerous financial and economic variables. The data runs quarterly from the years 2000 through 2016. Before doing more complex econometric modeling, you are interested in seeing if there is a basic predictive model that can be created from your data for Gross Domestic Product (GDP). Therefore, you are interested in utilizing GDP as a dependent variable and several predictor (independent) variables to generate a statistically significant regression model.
Research Question: What financial and economic variables effect quarterly Gross Domestic Product?
Resources: Utilize the data set (Excel file), PHStat, textbook and mortgage example as primary resources for completing the assignment. This assignment should be completed individually.
Three separate files:
1. Word document which includes part #1, Part#2, and Part #3
2. Best subset Regression Excel file generated for part# 1: lastname-firstinitial part1
3. Multiple regression Excel file generated for part# 2: lastname-firstinitial part2
Part 1 (24 points)
Utilizing PHStat, run a Best Subsets regression for GDP. Use the following 5 variables as predictors: S&P Quarterly Close, 10yr Treasury, M2 Supply, Unemployment Rate and Housing Starts. Use 95% confidence level.
TIPS: When selecting columns of data, start with the title cell in Row 3 so your output is labeled. To select multiple columns of cell data not next to each other hold down the appropriate keyboard key prior to selecting the next group of cells (i.e. use the Control key for Windows PC and Command key if using a Mac).
Submit for Part #1:
a.) Using adjusted R-squared as the key metric, identify the most significant model. Copy and paste the Excel sheet output (regression stats and ANOVA) for the best model (the info from column A to I only) into a Word document. Change the Word page orientation to landscape so it all fits on the page?Layout menu, Orientation drop down, select Landscape.
b.) Write the identified best model name from the column A of the "Bestsubsets" tab on the word document. For example: X1X2X3
c.) Submit excel file for Best Subsets generated for part#1. Name the file: lastname- first initial part 1
Part 2 (24 points)
Utilizing PHStat, run a regular Multiple Regression for GDP using the same 5 predictor variables as in part 1. In the options part of the input table select ANOVA and Coefficients Table, Durbin-Watson Statistic and VIF. Use 95% confidence level.
TIP: The regression statistics and ANOVA output should match your identified Best Subsets model output. Submit for Part #2: Submit the excel file for generated part # 2. Name the file lastname first initial part2
Copy and paste the following Excel items into your Word document.
1. Durbin-Watson Statistic output.
2. VIF output (from columns A & B only) for the lowest VIF score.
3. VIF output (from columns A & B only) for the highest VIF score.
4. Using an Excel function, calculate the Critical F-score for the model and include the result in your Word document. Write the excel function used including the values of the variables.
Part 3 (52 points)
Submit for Part #3: Answer the following questions related to your output from parts 1 and 2. Include them in the same Word document you used for the other parts.
1. Based on the ANOVA coefficients (use 4 decimal places) and variables in the output, type the regression equation for this model utilizing the proper format (y = b0 + b1x1 + b2x2....)
2. Using the estimated regression equation and all the variables in the model, calculate (show your work) the expected change in GDP when:
S&P 500 index declines by 2.25%
10-year Treasury rate average is 2.9%
M2 money supply increases 1.9%
Unemployment rate declines by 1.5%
Housing starts increase by 3% Show the calculation.
3. Which independent variable(s) in the model are statistically significant and how did you make that determination?
4. Which independent variable(s) in the model are statistically insignificant and how did you make that determination?
5. For any statistically insignificant variables in the model how could the lack of significance be indicated from the 95% confidence intervals in the output?
6. For any of the independent variables, if the 95% confidence range (lower and upper levels) was not given, how could you approximate it based on the other information in the table?
7. Interpret the coefficients for Treasury and M2 Supply by typing a statement for each that describes their respective effects on GDP due to a 1% change in the independent variable.
8. What is the Adjusted R-square value and what does it mean?
9. What is the F-statistic for the model and what does it mean?
10. Show the basic mathematical equations and solutions, using the data in the ANOVA output, for: Mean Square Regression (MSR) Mean Square Error (MSE) F-statistic
11. Is the overall model reliable/significant? How did you make that determination?
12. Is multicollinearity a concern for this model? Why?
13. Is autocorrelation a concern for this model? Why?
SPC Home SPC Stude mlc Projec QMB3 G Scena Q New T Y course course X QMBF + Pr( x Projec * Course Q New T Y how to G how to + D X C 0 https://docs.google.com/spreadsheets/d/11P8_8ZVqhkN8UQGsHpSzysCANwcJOKYoNgcCJNHdEMY/edit#gid=1133592925 Q Ag Moncler Isles Apart.. Thank You - - Answ Online Quote -Doc ... 2001 Hyundai XG30... mlcavi @ AutoRentals.com -... TC Chiffon Long Maro.. S Review and Purcha... Project Data 6 Share File Edit View Insert Format Data Tools Add-ons Help All changes saved in Drive M 100% $ % .0 .00 123 - Calibri 12 BISA 4 ERVO+MY - 2. A fx 2000 Q3 B C D E F G H K 66 % change Avg Qrtly Growth % change % change Democrat S&P 500 % change % change 10 year Rate (%) % change Consumer % change Housing or Republican Peri Qtrly Close Inflation GDP (real) Treasury (%) EPS M2 Supply Conf. Index Unemplete Starts President 2000 Q1 1.222 1.720 1.200 6.470 29.170 1.697 -3.246 -2.43 -6.089 0 2000 Q2 -3.482 0.701 7.800 6.180 22.700 0.736 1.532 0.000 -4.360 O 2000 Q3 -1.880 0.754 0.500 5.890 18.220 1.753 2.371 -2.500 -5.231 0 2000 Q4 -8.582 0.173 2.300 5.560 0.300 1.616 -0.561 0.000 2.682 2001 Q1 -12.664 1.264 -1.100 5.050 -13.590 3.024 -17.502 10.256 3.951 H 2001 Q2 4.780 1.022 2.100 5.270 -31.140 1.776 1.711 4.651 1.558 H 10 2001 Q3 -15.260 0.169 -1.300 4.980 -48.700 3.732 -18.419 11.111 -1.861 11 2001 Q4 9.960 -0.897 1.100 4.780 -51.840 1.486 32.577 14.000 -1.855 12 2002 Q1 -0.379 1.188 3.700 5.080 -46.930 0.734 -13.919 0.000 9.745 13 2002 Q2 -14.053 0.615 2.200 5.100 -28.780 1.138 -3.975 1.754 -1.857 14 2002 Q3 -17.999 0.611 2.000 4.250 4.270 2.091 -11.853 -1.724 0.375 H 15 2002 Q4 7.335 -0.055 0.300 4.010 9.960 1.882 0.961 5.263 1.905 HH 16 2003 Q1 -4.187 1.824 2.100 3.920 20.120 1.651 -35.095 -1.667 0.366 17 2003 Q2 14.5 -0.271 3.800 3.610 26.100 2.501 35.993 6.780 1.018 2002 02 1 6An n 917 4 ann A 2An 25 nAn n 757 -7 78A -2 175 7 755 QMB3200 project data + Explore O D 10:17SPC Home\\ \\SPC Studer WE Project OMB 3| G Sicena| Q NewTO COURSE\\\\ COURSE| X QMBF PR X| Projectours\\ Q NewT ` howto| G how to \\\\ + X https : / / docs . google . com / spreadsheets / 4 / 1 1 P &_ & Z V q h k N & U Q G S HD SZys CAN W C J O K Y ON ` C C J N H J EMY / edit # gid = 713.3.592925) ` Moncler Isles Apart. Thank You - - Answ Online Quote - DOC .." $ 2001 Hyundai X G 30 .` WE avi*@ AutoRentals . com . .. [19 Chiffon Long Maro .\\ 5 Review and Purcha . Project Data File Edit View Insert Format Data Tools Add-ons Help* All changes saved in Drive 100% -| $ 8 0 . 00 123 -\\\\ Calibri \\ 12 -| B I S A S. THEE - | _ _ _ _ HH - P - | Q {\\ \\ 7 - 2 - 2007 Q2 B D E F G H K 17 2003 Q2 14.526 - 0 . 271 3. 800 3.610 26. 100 2.501 35. 993 6. 780 1. 018 1 BL 2003 Q3 1. 640 0 . 817 6.900 4. 240 25. 060 0 . 757 - 7.784 3.175 7.755 1 79 2003 04 11 . 115 - 0 . 432 4 . 800 4 . 290 72.450 0 . 076 4 . 805 - 6.557 7.726 20 2004 Q1 0 . 409 1 . 627 2.300 4. 020 68.450 1.699 9.665 1 . 754 -5.764 21 2004 Q2 0 . 425 1 . 227 3.000 4. 610 59 . 180 1. 680 16.158 3.448 0. 990 22 2004 Q3 -2.899 0 . 105 3. 700 4. 300 46. 740 1 .433 - 5.934 - 3.571 2.047 23 2004 04 7.976 0 . 211 3.500 4. 170 17.010 1 . 1 12 - 1.965 0. 000 - 0. 590 24 2005 Q1 3.479 1.576 4. 300 4. 300 12.410 0. 301 8.650 3.704 5. 410 25 2005 Q2 0 . 182 0 . 621 2. 100 4 . 160 9.480 1. 081 3.107 - 3.846 - 0 . 981 26 2005 Q3 2.191 2.211 3.400 4 . 220 11 .210 1 .465 17. 608 0. 000 2.372 27 2005 04 0 . 820 -1.006 2. 300 4.480 15 . 280 1 . 118 17. 371 - 2.000 -1.492 2 8 2006 Q1 2.922 1 . 524 4. 900 4.570 16.640 1 . 204 4.674 -4.082 2.498 29 2006 Q2 - 2. 688 1. 552 1 . 200 3.070 13. 340 1. 368 1 .953 -2 . 128 12.514 30 2006 Q3 4. 440 0 . 000 0 . 400 4. 890 14.460 1. 256 0 . 474 - 2. 174 - 8.230 31 2006 04 5. 802 - 0 . 542 3. 200 4. 630 13. 230 2. 026 - 1.983 - 2 .222 - 7.774 32 2007 Q1 0 . 933 1 . 784 0 . 200 4. 680 11 . 180 1 . 389 4. 239 0. 000 - 6.921 1 3.3 2007 Q2 5 . 218 1.461 3 . 100 4. 850 11 . 250 1 . 366 - 2.680 4 . 545 - 0 . 707 onin7 12 Anna } Thin A 720 _ _ AANY 1 EAT _ = END 7 171 - 19 1 65 Q MB 3. 200 project data - ~` Explore* @ ) M [ D D 'H TOATESPC Home SPC Stude mlc Projec QMB3 G Scena Q New T Y course course X QMBF + Pr( x Projec * Course Q New T Y how to G how to + D X C 0 https://docs.google.com/spreadsheets/d/11P8_8ZVqhkN8UQGsHpSzysCANwcJOKYoNgcCJNHdEMY/edit#gid=1133592925 Q Ag Moncler Isles Apart.. Thank You - - Answ Online Quote -Doc ... 2001 Hyundai XG30... mlcavi @ AutoRentals.com -... TC Chiffon Long Maro.. S Review and Purcha... Project Data 6 Share File Edit View Insert Format Data Tools Add-ons Help All changes saved in Drive M 100% $ % .0 .00 123 - Calibri 12 BISA 4 EVO+MY - 2. A fx 2011 Q3 B C D E F G H K 34 2007 Q3 1.206 0.048 2.700 4.730 -2.440 1.547 -5.508 2.174 -11.165 1 35 2007 Q4 -4.242 0.719 1.400 4.260 -21.050 1.119 10.5 6 36 2008 Q1 -10.432 1.667 -2.700 3.660 -29.680 2.628 -41.364 search.hfreeformsnow.com . now ^ 37 2008 Q2 -3.696 2.482 0.669 N O 2.000 3.890 -41.820 -21.860 The No. 1 Stock to Buy 38 2008 Q3 -9.498 0.000 1.900 3.860 -44.150 2.827 18.651 co This tech is going to "hit the reset button" on all 39 2008 Q4 -22.668 3.931 -8.200 3.250 -79.480 3.585 51.505 19 human activity... 40 2009 Q1 -11.885 1.189 -5.400 2.740 -90.270 1.555 -71.302 19 41 2009 Q2 15.414 1.410 -0.500 3.320 -86.800 0.707 89.615 42 2009 Q3 15.010 0.139 1.300 3.520 -73.860 0.233 7.708 co 43 2009 Q4 5.177 -0.046 3.900 3.470 261.660 0.548 -0.377 44 2010 Q1 4.504 0.787 1.700 3.720 905.560 0.422 -0.756 45 2010 Q2 -12.252 0.184 3.900 3.490 870.400 1.191 0.762 46 2010 Q3 10.217 0.183 2.700 2.790 492.530 0.909 -8.318 47 2010 Q4 9.641 0.366 2.500 2.870 49.720 1.457 8.247 48 2011 Q1 4.959 1.962 -1.500 3.460 31.360 1.473 20.762 49 2011 Q2 -1.112 0.984 2.900 3.210 22.280 2.721 -7.729 50 2011 Q3 -14.842 0.532 0.800 2.410 17.640 3.851 -22.393 2011 0A 10 002 _n 520 2 0An 1 07A 12 n QMB3200 project data - CLICK HERE TO FIND OUT MORE O D 2 10:18SPC Home\\ \\SPC Studer WE Project OMB 3| G Sicena| Q NewTO COURSE\\\\ COURSE| X QMBF PR X| Projectours\\ Q NewT ` howto| G how to \\\\ + X https : / / docs . google . com / spreadsheets / 4 / 1 1 P &_ & Z V q h k N & U Q G S HD SZys CAN W C J O K Y ON ` C C J N H J EMY / edit # gid = 713.3.592925) ` Moncler Isles Apart. Thank You - - Answ Online Quote - DOC .." $ 2001 Hyundai X G 30 .` WE avi*@ AutoRentals . com . .. [19 Chiffon Long Maro .\\ 5 Review and Purcha . Project Data File Edit View Insert Format Data Tools Add-ons Help* All changes saved in Drive 100% -| $ $ 0 . 09 123 -\\\\ Calibri \\ 12 -| B I S A S. THEE - | _ _ _ _ H - P -| Q { \\ 7 - 2 - 2015 03 B D E F G H K 50 \\2011 Q3 14.842 0 . 532 0 . 800 2.410 17.640 3.851 -22. 393 -1.099 7.835 O 57 2011 04 10.993 - 0 . 529 4. 600 2.040 8.860 1. 074 42. 070 5.556 8.450 O 52 2012 Q1 11 .408 1. 639 2. 700 2.040 5.470 2. 038 8.837 3.529 5. 310 O 5.3 2012 Q2 -3. 728 0 . 044 1. 900 1 . 830 2.030 1 . 493 11 . 681 0. 000 4.524 O 5 4 2012 Q3 5 . 197 0 . 828 0. 500 1. 640 2 . 780 1.974 13 . 387 4 .878 5.546 O 55 2012 04 1.404 -0 . 778 0 . 100 1 . 710 - 2.450 3.274 - 7.397 1 . 282 16.361 O 56 2013 Q1 9.598 1 . 394 2. 800 1. 950 - 2.630 0 . 421 - 8.295 - 5. 063 4. 883 O 57 2013 Q2 2.151 0 . 301 0. 800 2.000 1. 650 0 . 949 36.348 0. 000 - 9.065 O 5 8 2013 Q3 4 . 183 0 . 257 3. 100 2.710 7.410 1.987 - 2.088 - 4. 000 1. 963 O 59 2013 Q4 9.356 - 0 . 470 4. 000 2.740 14 . 140 1 .430 - 2.008 -6.944 14.572 O 60 2014 Q1 0. 878 1.416 - 0. 900 2.760 13. 350 1 . 749 5. 378 0. 000 - 6.985 O 67 2014 Q2 4. 108 0 . 846 4.600 2.620 11.670 1.554 3.524 8.955 4. 605 O 62 2014 Q3 0 . 159 - 0 . 126 5 . 200 2. 500 10.460 1. 003 0 . 939 3 .279 3.894 O 6.3 2014 04 4. 240 - 1 . 345 2.000 2. 280 0. 550 1. 605 7.67 4 -5. 085 3. 292 O 64 2015 Q1 0 . 454 0. 554 3 . 200 1. 960 - 2 . 720 1 .674 9.395 . 3 .571 - 6.532 O 65 2015 Q2 -0 . 767 1. 059 2. 700 2.160 - 8.540 1. 230 0. 099 - 1 DEN AT MANY X 6.6 \\2015 Q3 -7.247 - 0 . 293 1. 600 2. 220 14. 600 1. 034 1.578 - 5 ` search . hifreeformsnow . com " now* F. ] 4. 725 _ n EQQ oron - 15 FAN 1 6 20 n The No . 1 Stock to Buy* Q MB 3 200 project data - This tech is going to " hit the reset button " on all . W @ ) [ D (2 ) ` TOMESPC Home\\ \\SPC Studer WE Project OMB 3| G Sicena| Q NewTO COURSE\\\\ COURSE| X QMBF PR X| Projectours\\ Q NewT ` howto| G how to \\\\ + X https : / / docs . google . com / spreadsheets / 4 / 1 1 P &_ & Z V q h k N & U Q G S HD SZys CAN W C J O K Y ON ` C C J N H J EMY / edit # gid = 713.3.592925) ` Moncler Isles Apart. Thank You - - Answ Online Quote - DOC .." $ 2001 Hyundai X G 30 .` WE avi*@ AutoRentals . com . .. [19 Chiffon Long Maro .\\ 5 Review and Purcha . Project Data File Edit View Insert Format Data Tools Add-ons Help* All changes saved in Drive 100% -| $ $ 10 . 00 123 -\\\\ Calibri \\ 12 -| B I S A S. HH EE _ _ _ _ _ H - P - | | | 8 - 2 - B D E F G H K 55 \\2012 04 - 1.404 - 0 . 778 0. 100 1 . 710 - 2.450 3.274 -7.397 1 . 282 16.361 O 56 2013 Q1 9.598 1. 394 2.800 1. 950 2.630 0 . 421 - 8.295 5. 063 4. 883 O 57 2013 Q2 2.151 0 . 301 0. 800 2.000 1. 650 0 . 949 36.348 0. 000 - 9.065 O 5 8 2013 Q3 4 . 183 0 . 257 3. 100 2.710 7.410 1. 987 - 2.088 - 4.000 1. 963 O 59 2013 Q4 9.356 - 0 . 470 4.000 2.740 14 . 140 1. 430 - 2.008 6.944 14 .572 O 60 2014 Q1 0. 878 1.416 0. 900 2.760 13. 350 1 . 749 5. 378 0. DOO - 6.985 O 67 2014 Q2 4 . 108 0 . 846 4. 600 2.626 11.670 1.554 3.524 - 8.955 4. 605 O 62 2014 Q3 0 . 159 - 0 . 126 5. 200 2.500 10.460 1.003 0 . 939 -3.279 3. 894 O 63 2014 04 4 . 240 - 1 . 345 2.000 2. 280 0 . 550 1. 605 7.674 - 5. 085 3 . 292 O 64 2015 Q1 0 . 454 0. 554 3. 200 1. 960 2. 720 1.674 9.395 - 3.571 - 6.532 O 65 2015 Q2 - 0 . 767 1.059 2. 700 2. 160 - 8.540 1 . 230 0. 099 - 1 . 852 17.049 O 6.5 2015 Q3 - 7.247 - 0 . 293 1. 600 2.220 14. 600 1. 034 1 .578 - 5.660 0 . 461 O 67 2015 04 6. 235 - 0 . 588 0 . 500 2. 190 15 . 560 1. 638 6. 311 0 . 000 - 3. 158 GB 2016 Q1 0. 710 0 . 677 0 . 600 1. 920 13 . 240 2. 385 -0 . 311 0. 000 2.579 O 69 2016 Q2 1 . 288 1 . 218 2.200 1 . 750 - 9.010 1. 616 1 . 871 2.000 0. 376 O OL X 71 $ search . hfreeformsnow . com " now * 79 The No . 1 Stock to Buy* + This tech is going to " hit the reset button " on all . E Q MB 3 200 project data - O ) [ D] (2 ) '` TO``
