

Answered step by step
Verified Expert Solution
Question
1 Approved Answer
Scilab Please 4. Use M B or Scilab to implement linear regression, and plot the points and the curve for the [01 812 27 andy
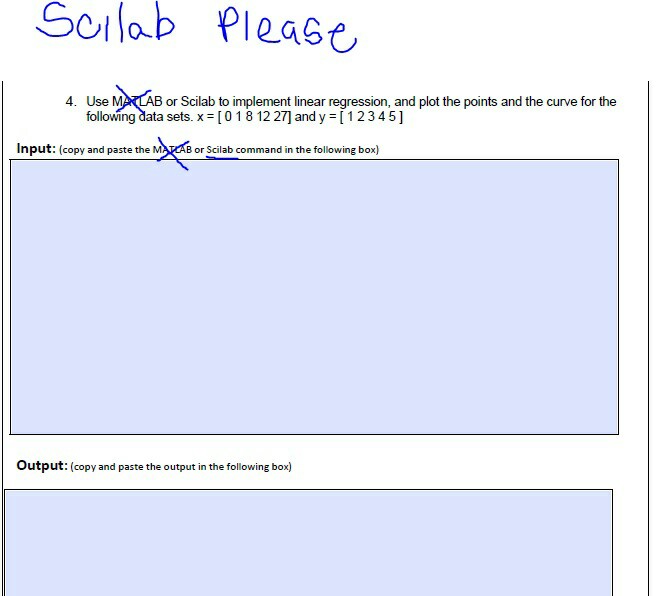
Scilab Please 4. Use M B or Scilab to implement linear regression, and plot the points and the curve for the [01 812 27 andy [1 2 3 4 5 Input: (copy and paste the M B or Scilab command in the following box) output copy and paste the output in the following box)
Step by Step Solution
There are 3 Steps involved in it
Step: 1

Get Instant Access to Expert-Tailored Solutions
See step-by-step solutions with expert insights and AI powered tools for academic success
Step: 2

Step: 3
Ace Your Homework with AI
Get the answers you need in no time with our AI-driven, step-by-step assistance
Get Started
Building Database Driven Catalogs
Authors: Sherif Danish
1st Edition
0070153078, 978-0070153073