Answered step by step
Verified Expert Solution
Link Copied!

Question

1 Approved Answer

Score: 1/10 1 / 4 answered Question 2 You are conducting a Goodness of Fit hypothesis test for the claim that all 5 categories are
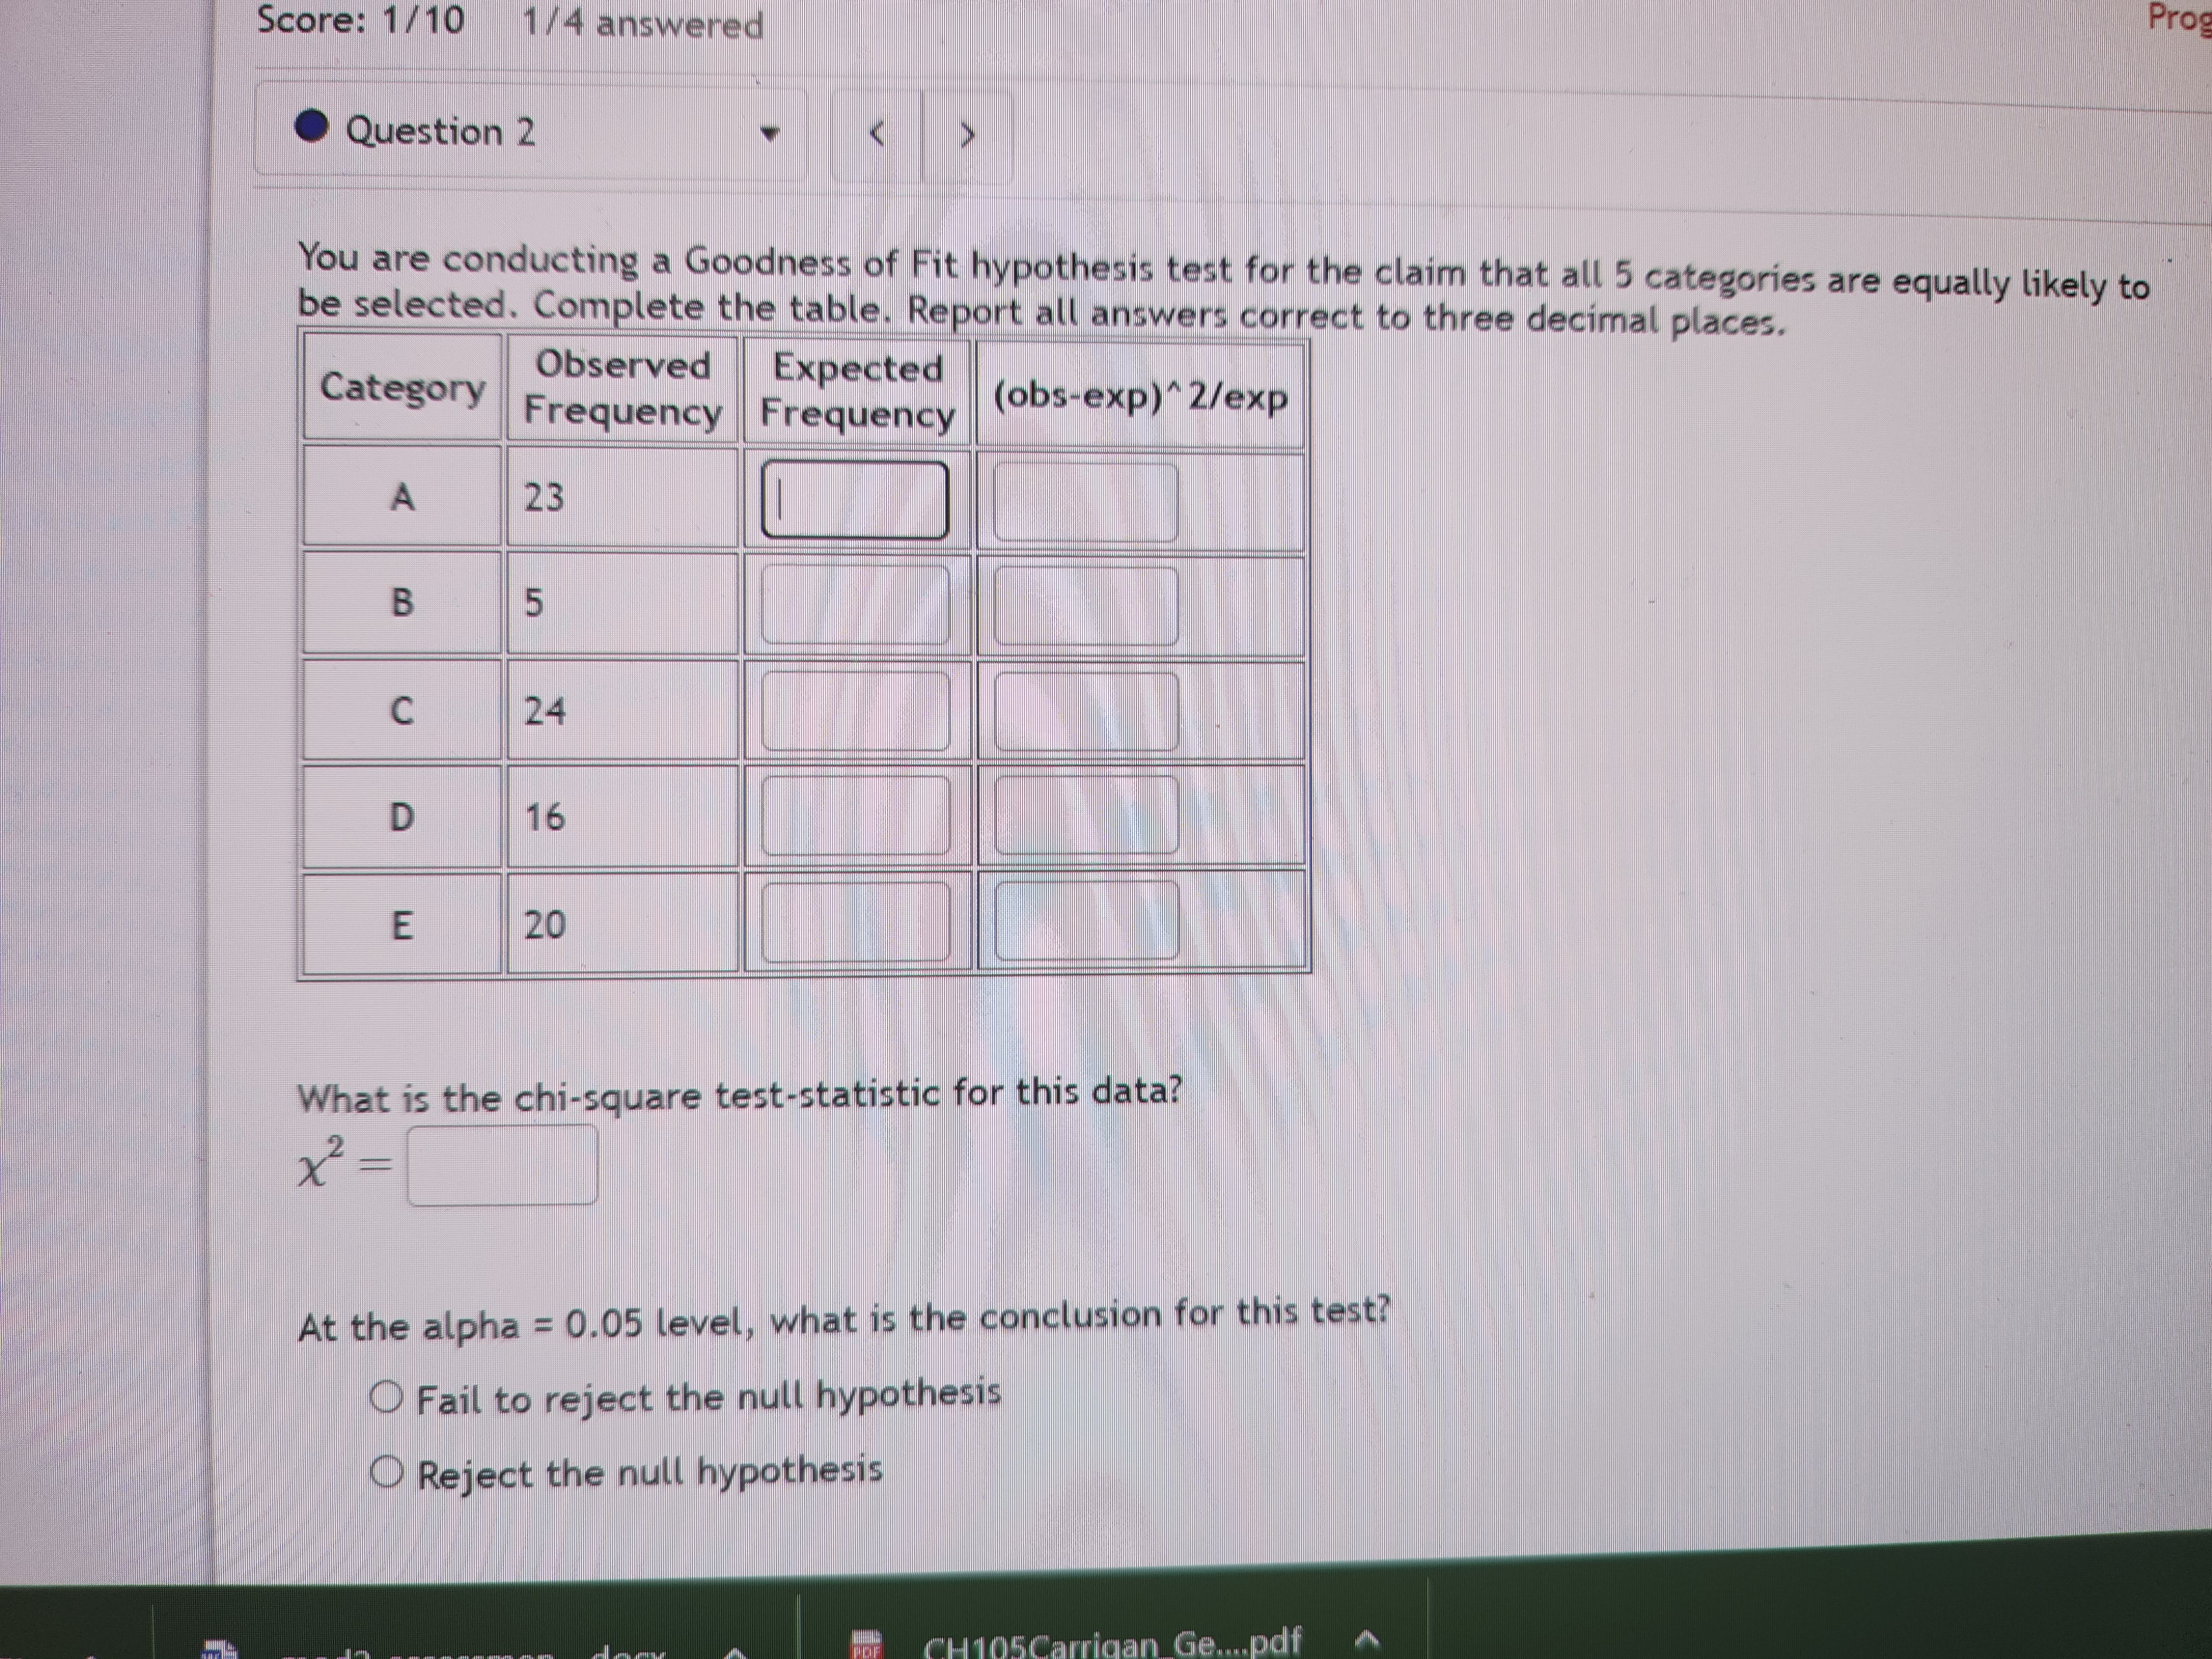
image text in transcribed
Score: 1/10 1 / 4 answered Question 2 You are conducting a Goodness of Fit hypothesis test for the claim that all 5 categories are equally likely to be selected. Complete the table. Report all answers correct to three decimal places. Observed Category Expected Frequency Frequency (obs-exp)" 2/exp A 23 B 5 C 24 D 16 E 20 What is the chi-square test-statistic for this data? At the alpha = 0.05 level, what is the conclusion for this test? O Fail to reject the null hypothesis Reject the null hypothesis Ge...pdf

Step by Step Solution

There are 3 Steps involved in it

Step: 1

blur-text-image

Get Instant Access to Expert-Tailored Solutions

See step-by-step solutions with expert insights and AI powered tools for academic success

Step: 2

blur-text-image

Step: 3

blur-text-image

Ace Your Homework with AI

Get the answers you need in no time with our AI-driven, step-by-step assistance

Get Started

Recommended Textbook for

Elementary Linear Algebra with Applications

Authors: Bernard Kolman, David Hill

9th edition

132296543, 978-0132296540

More Books

Students also viewed these Mathematics questions

Question

Why does an increase in NWC represent a cash outflow?

Answered: 1 week ago

Question

Answered: 1 week ago

Answered: 1 week ago