

Question: Screenshots 2 and 5 include two respectively, as the graphs did not fit in one screenshot. In total, there are 10 screenshots that need solving.
Screenshots 2 and 5 include two respectively, as the graphs did not fit in one screenshot. In total, there are 10 screenshots that need solving. I DO NOT NEED ANY EXPLANATIONS! ONLY ANSWERS. As so, only answer the BLANK spaces in each screenshot! THERE ARE NO MULTIPLE PARTS! ONLY ANSWER WHAT YOU NEED TO! THANKS.
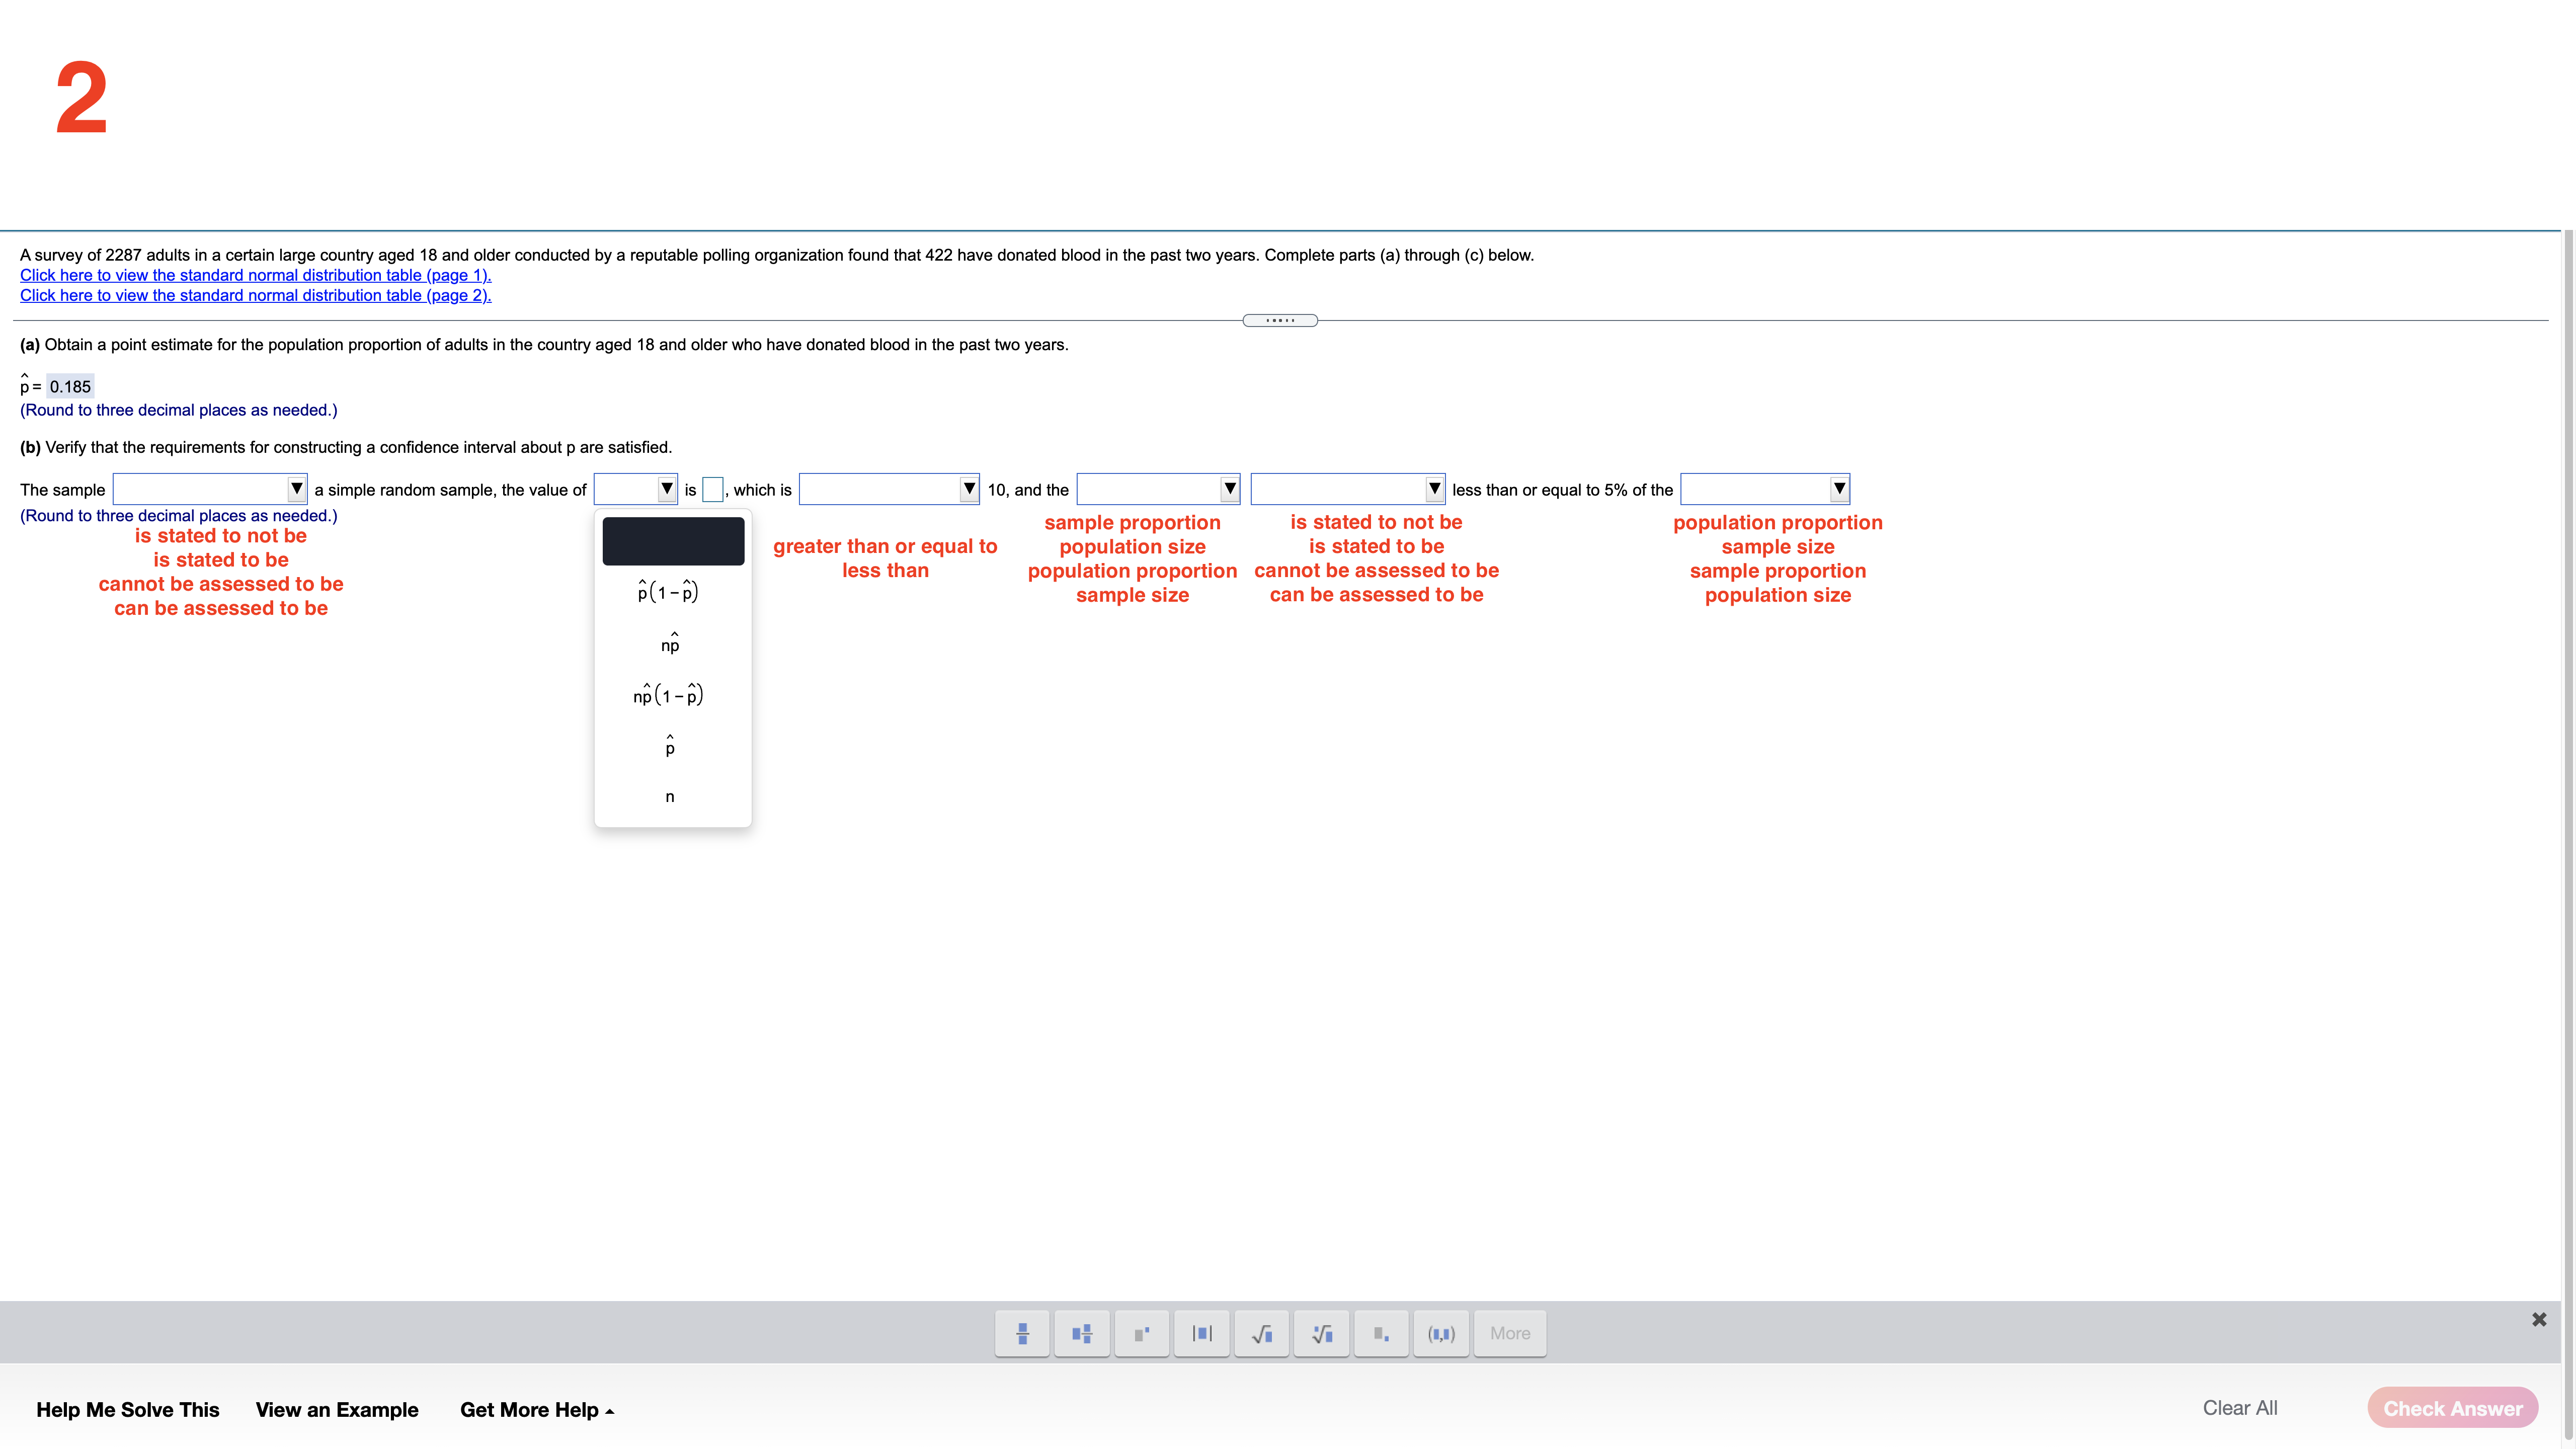
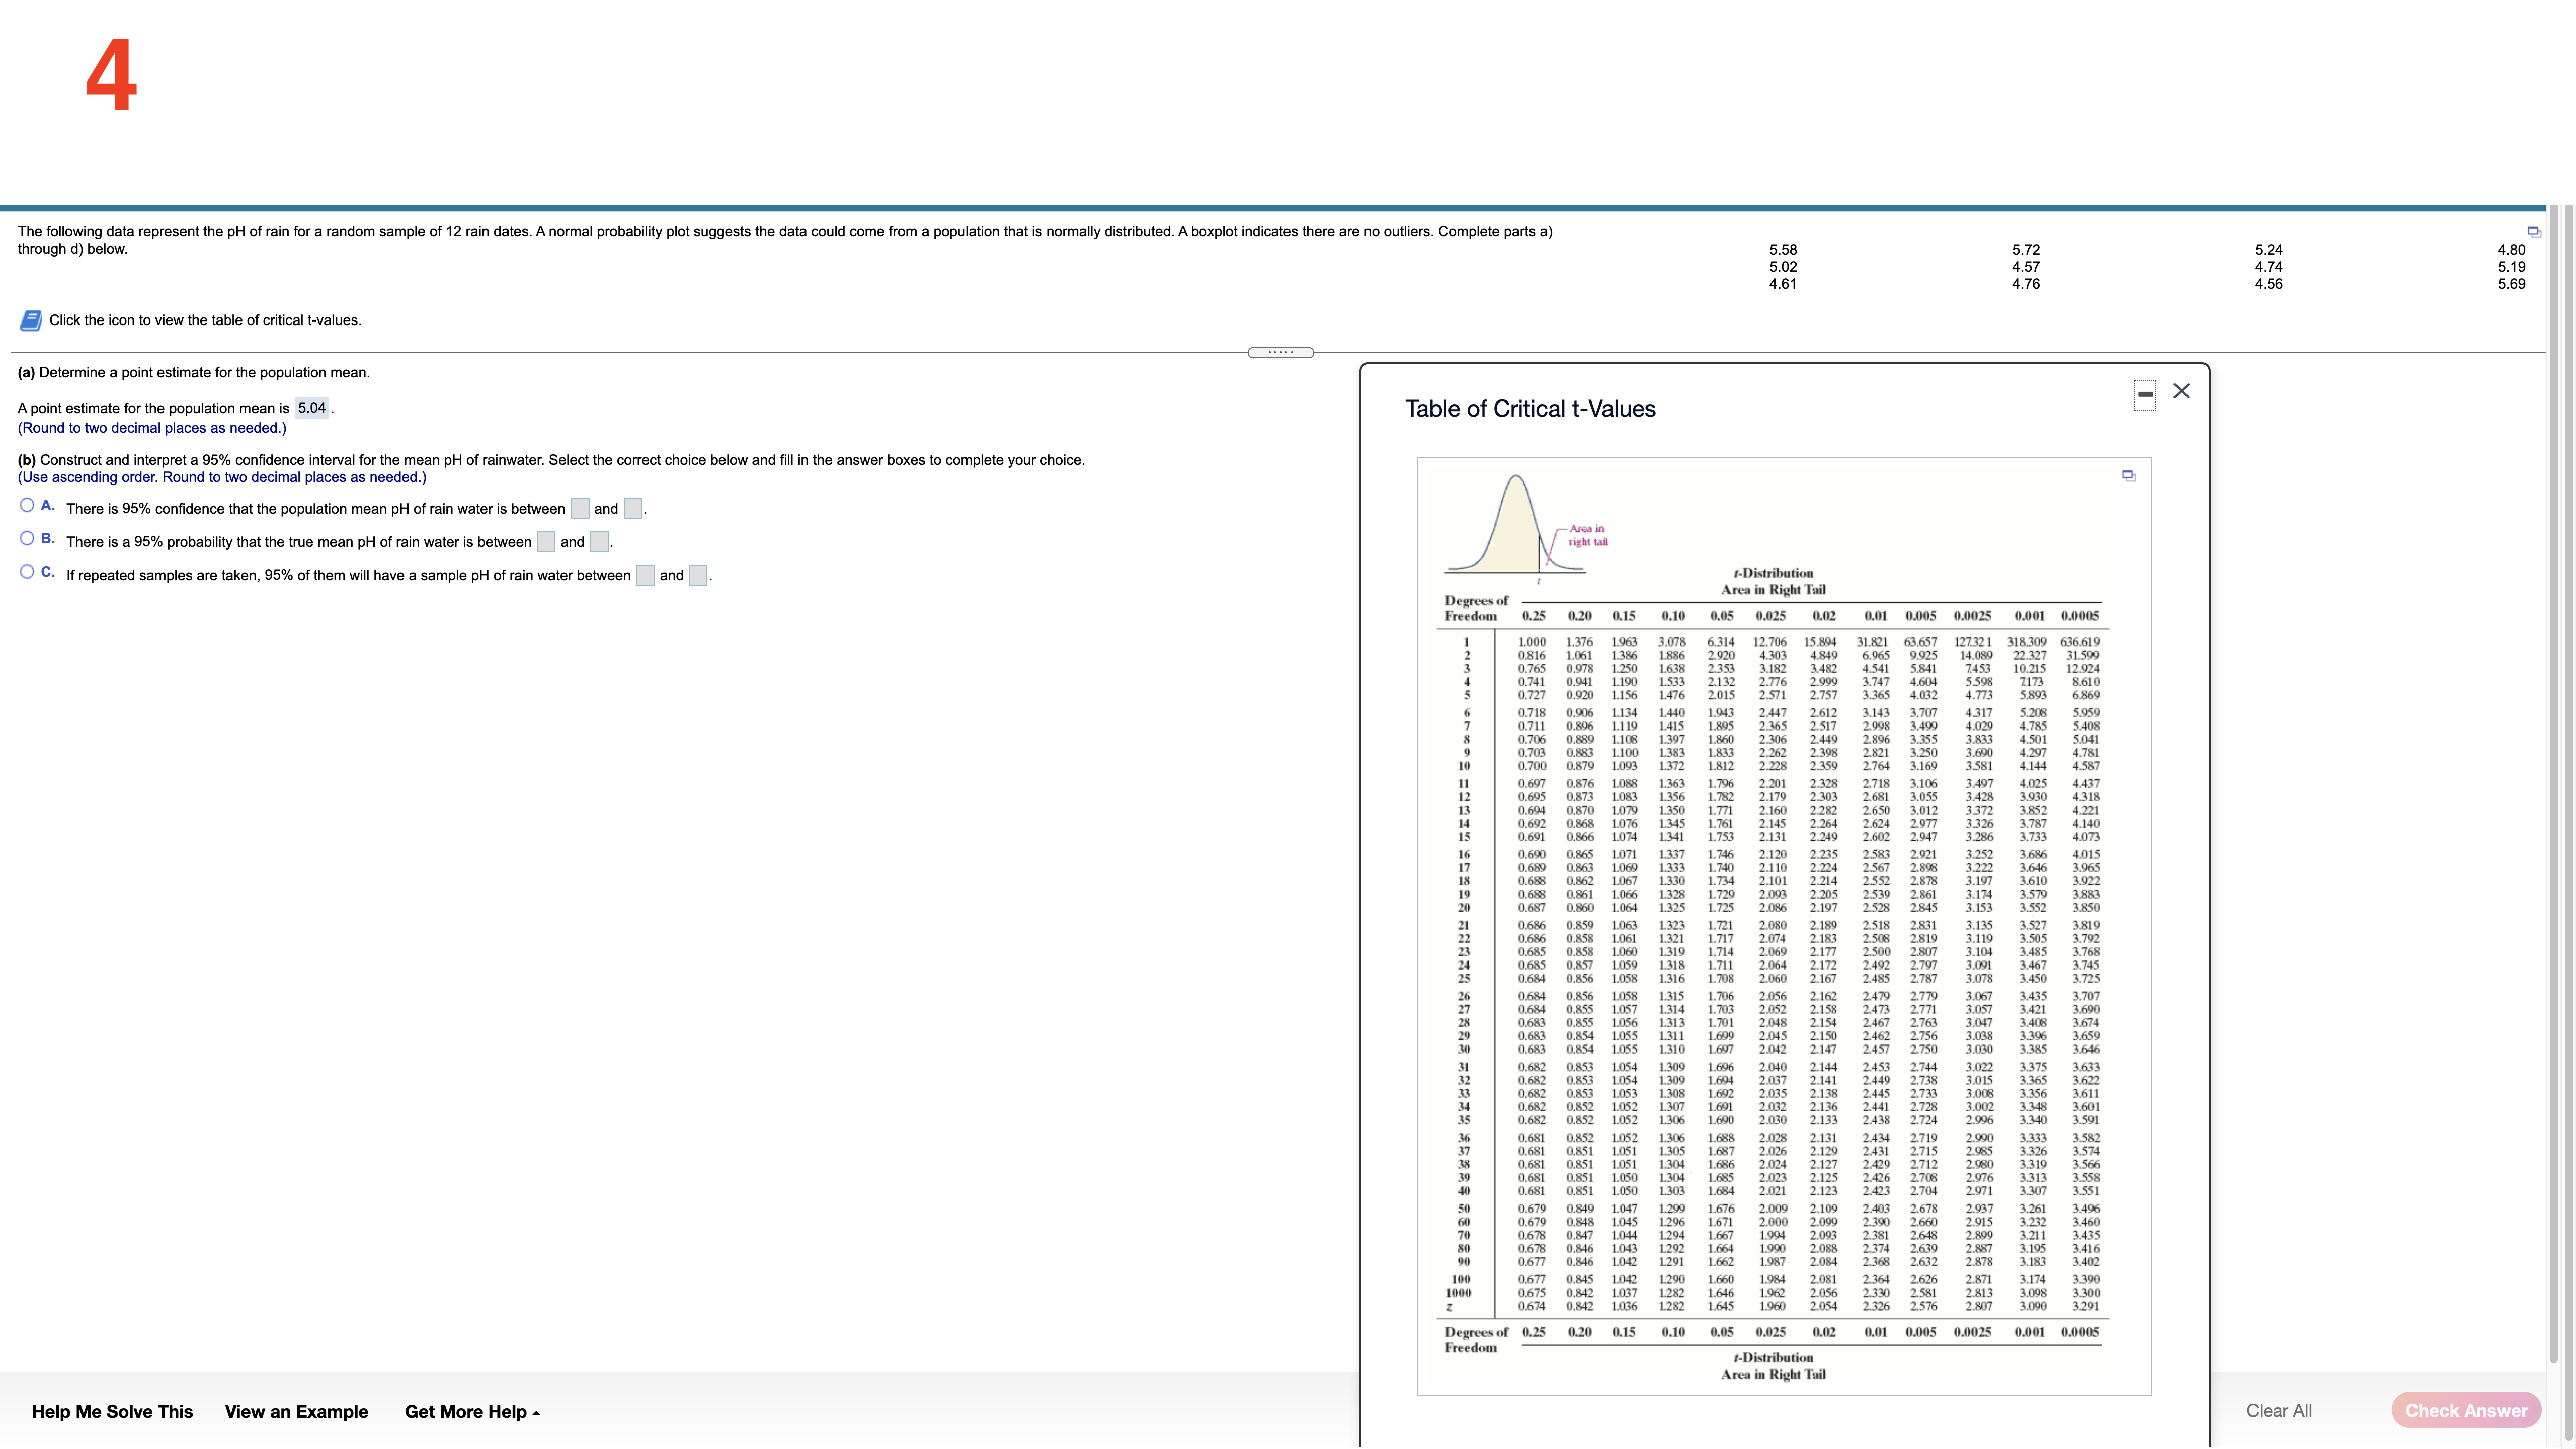
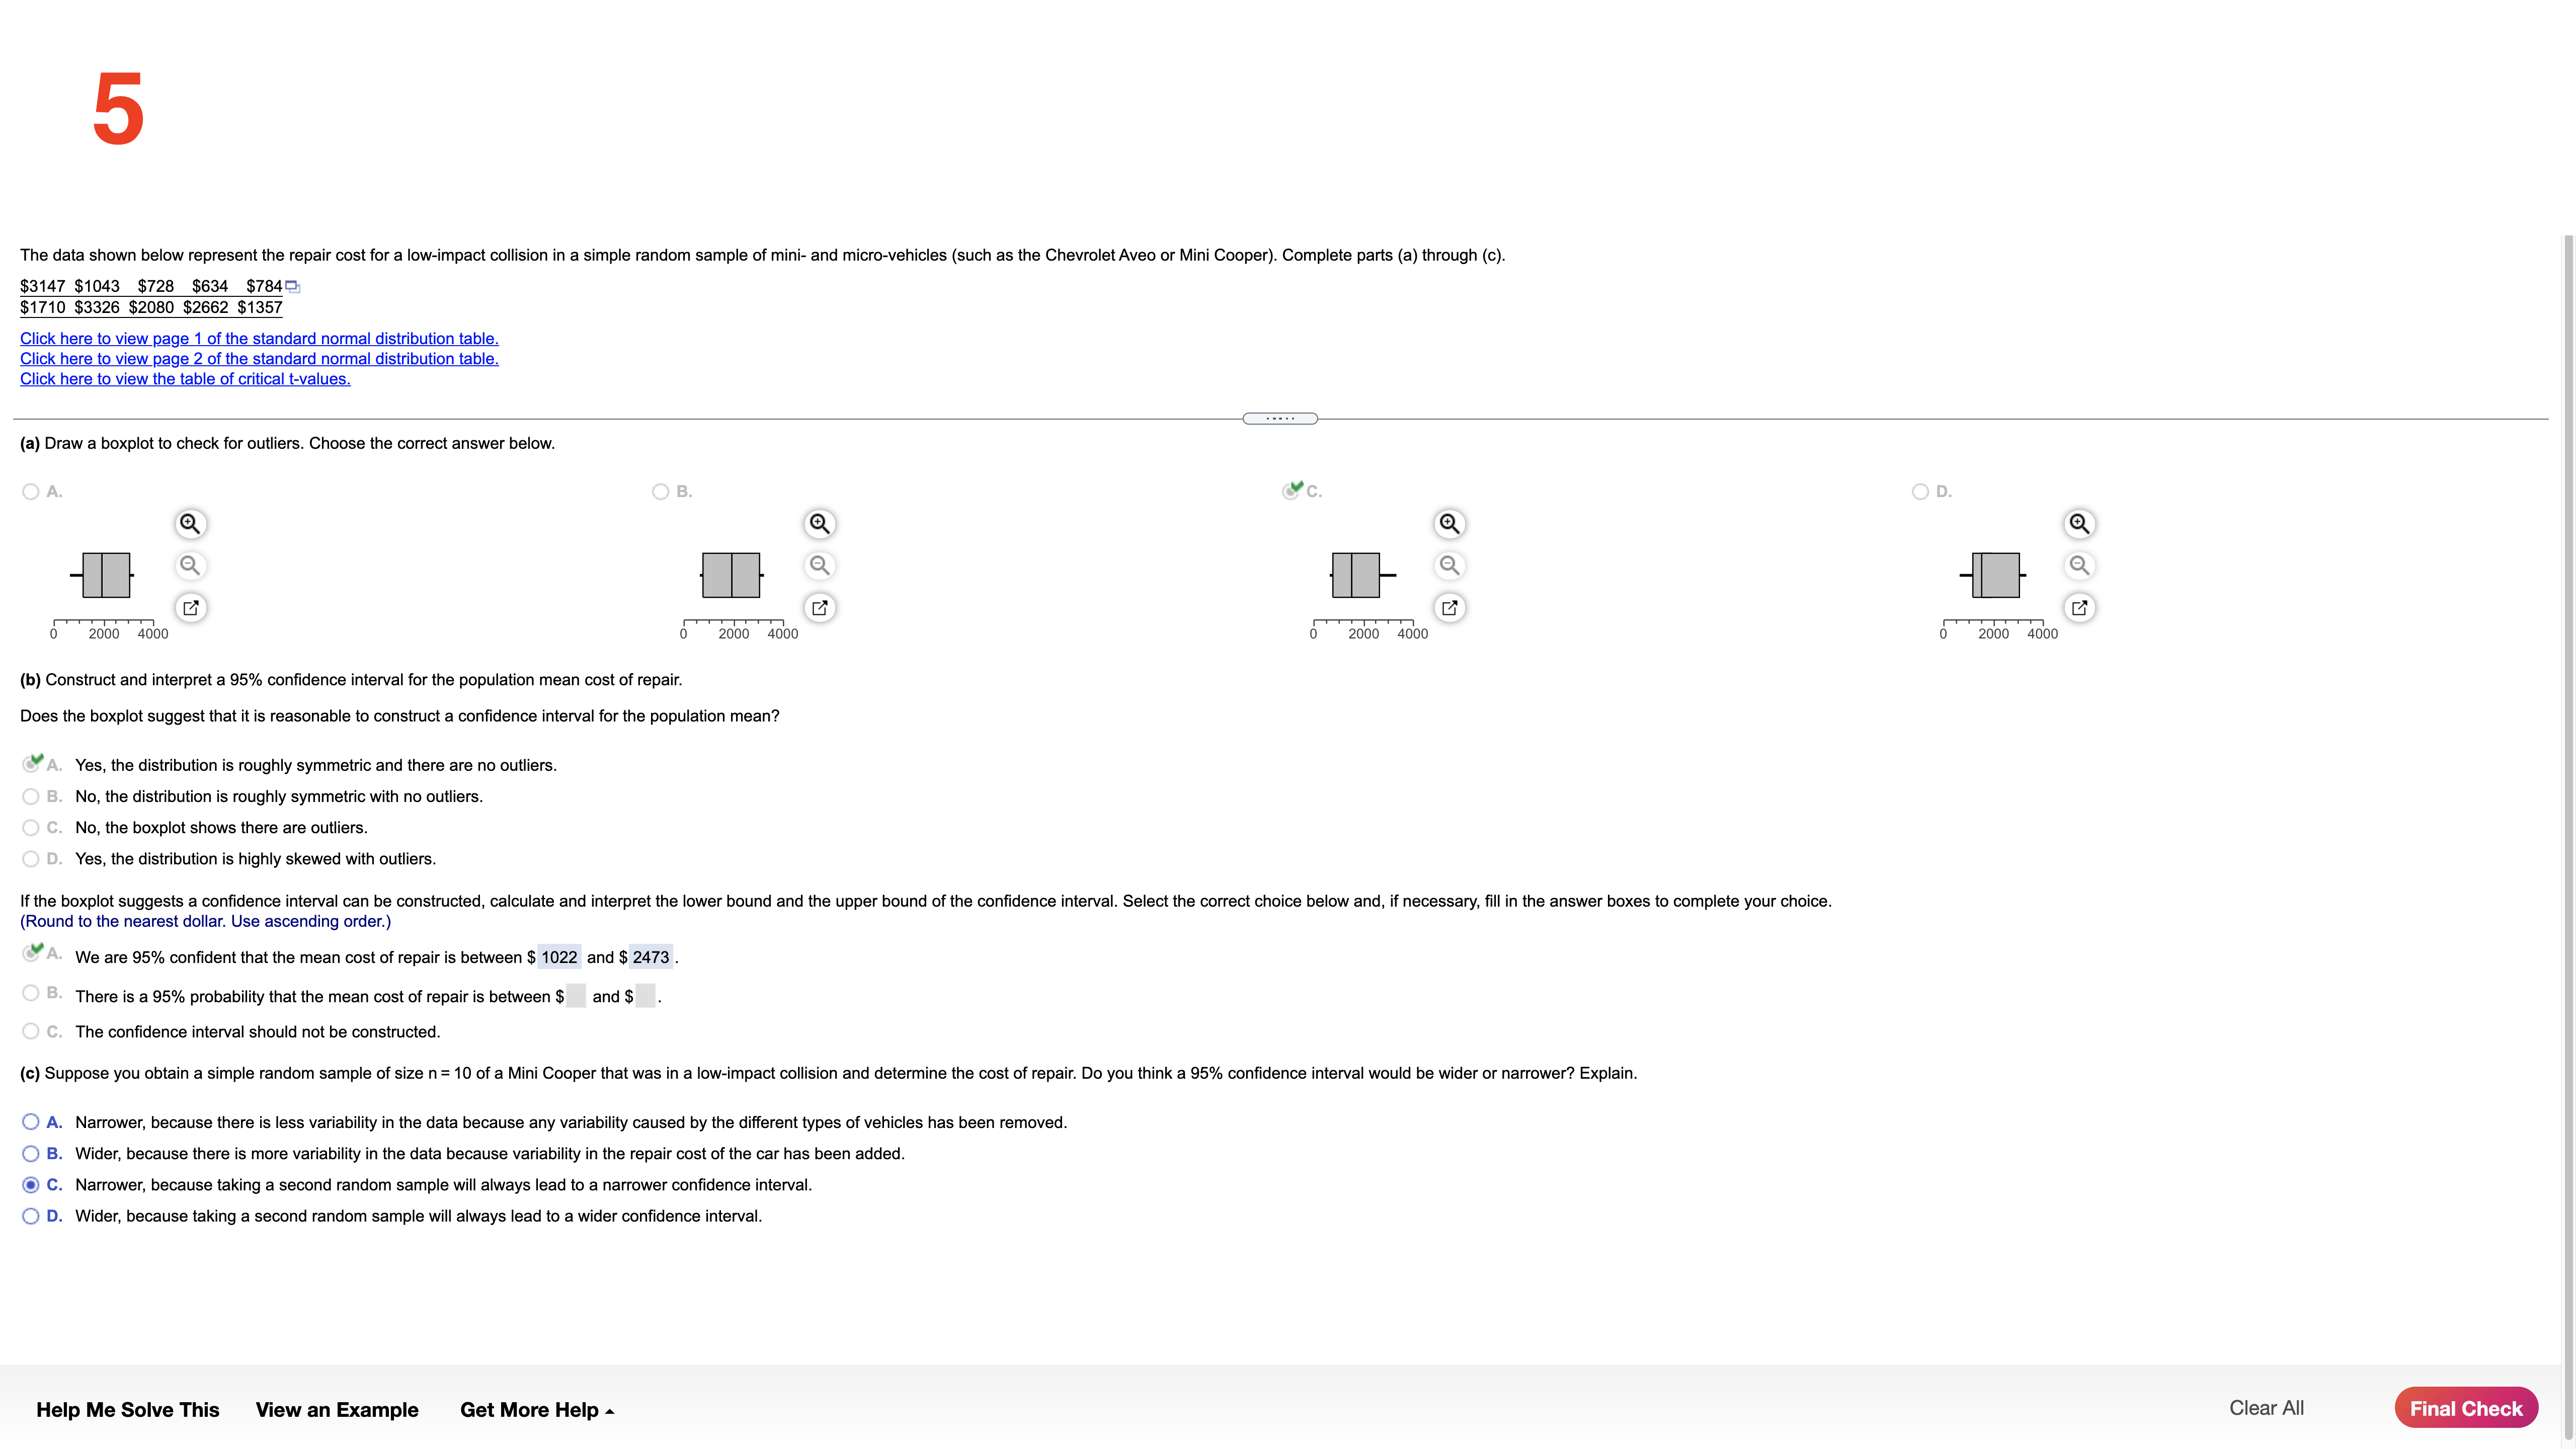
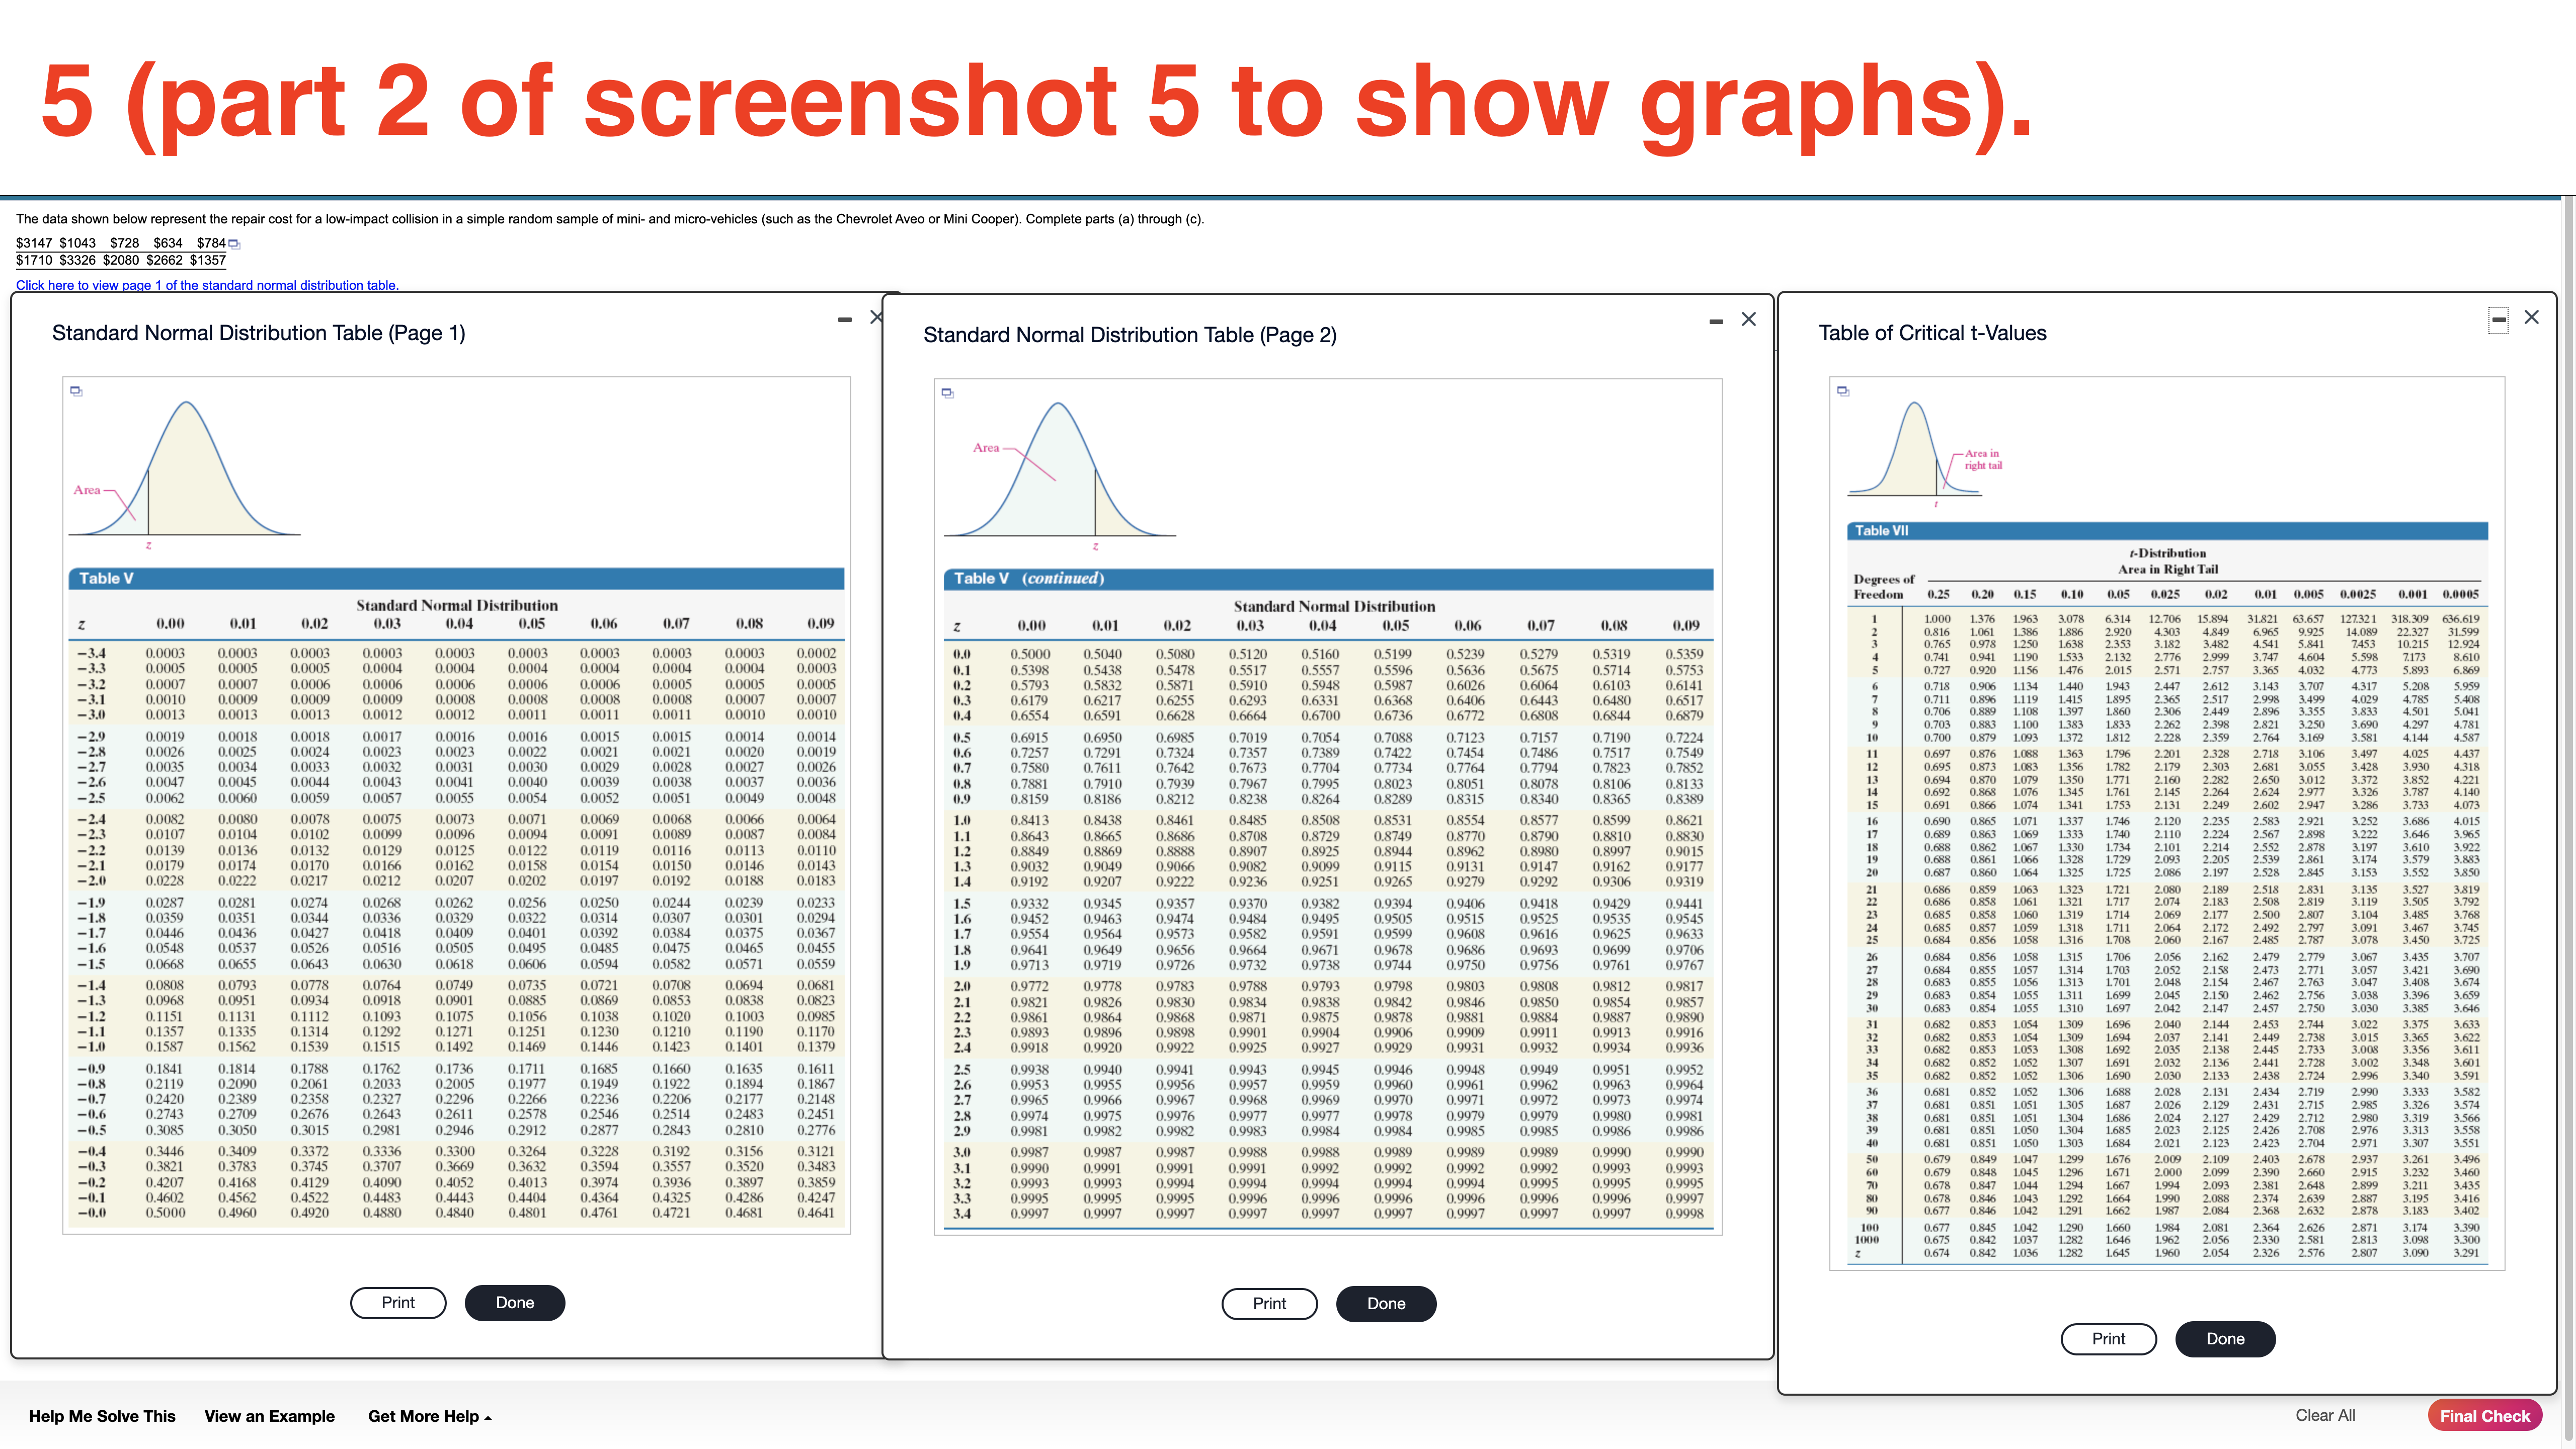
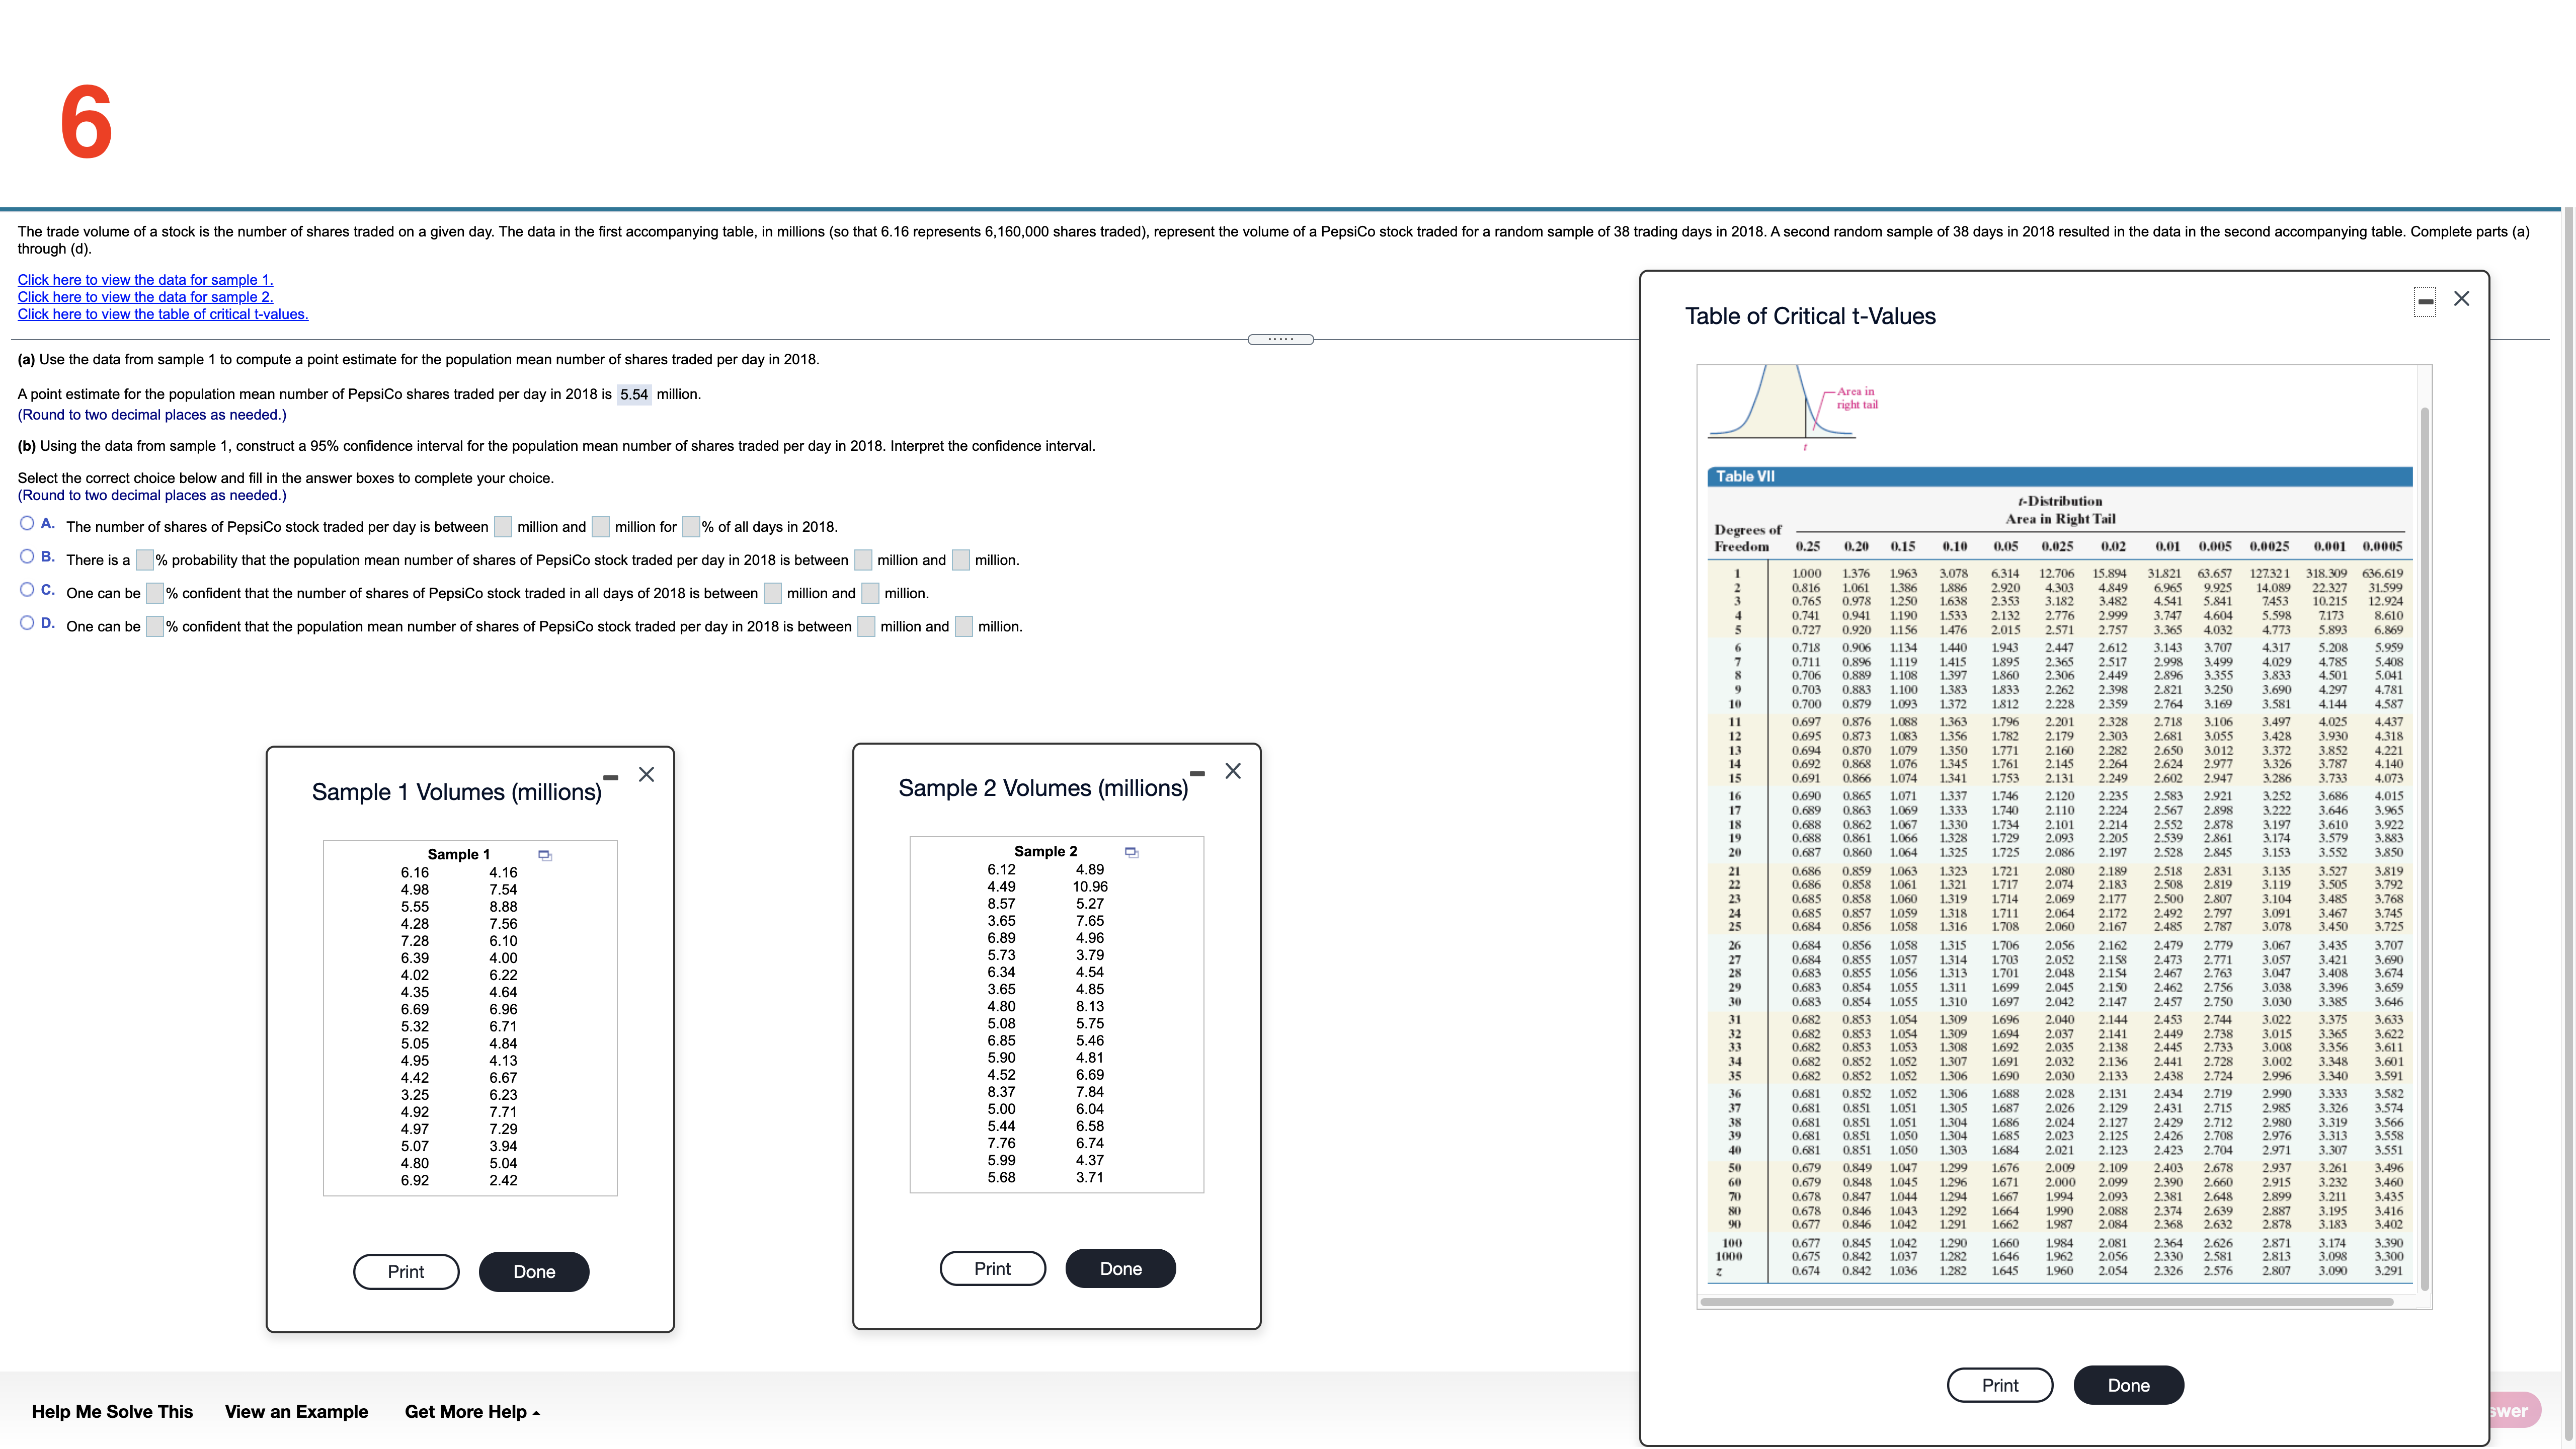
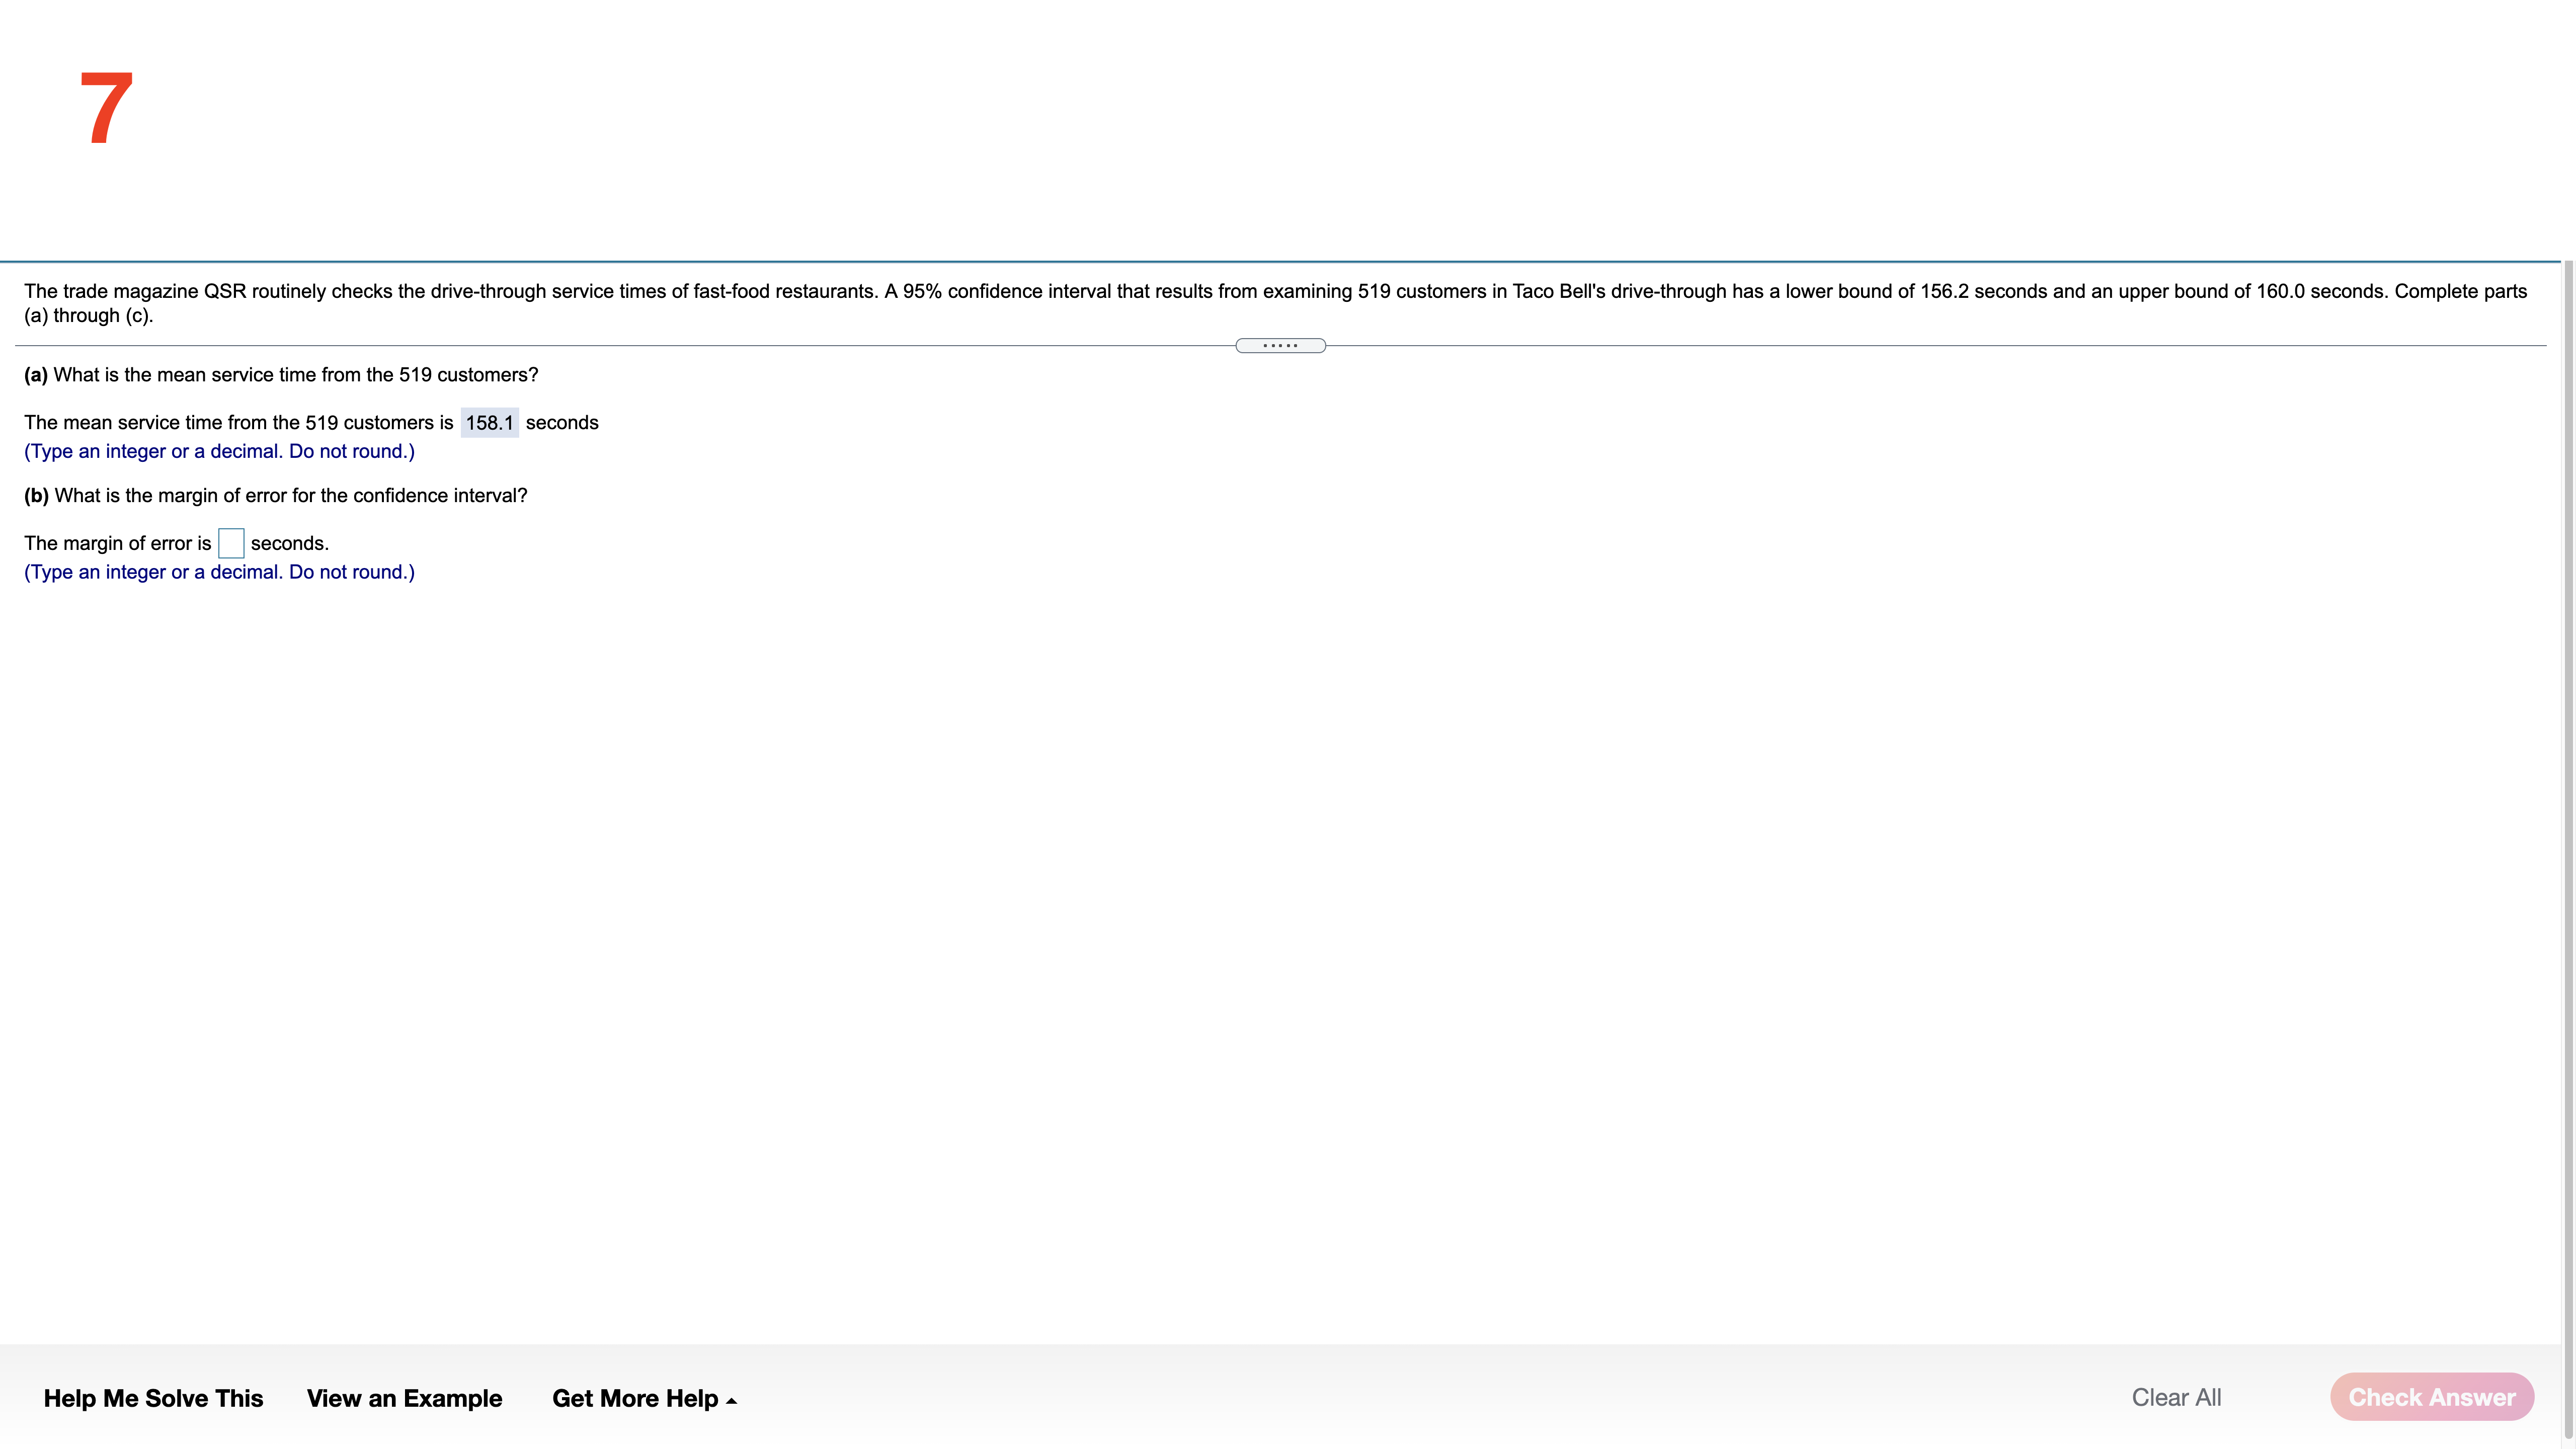
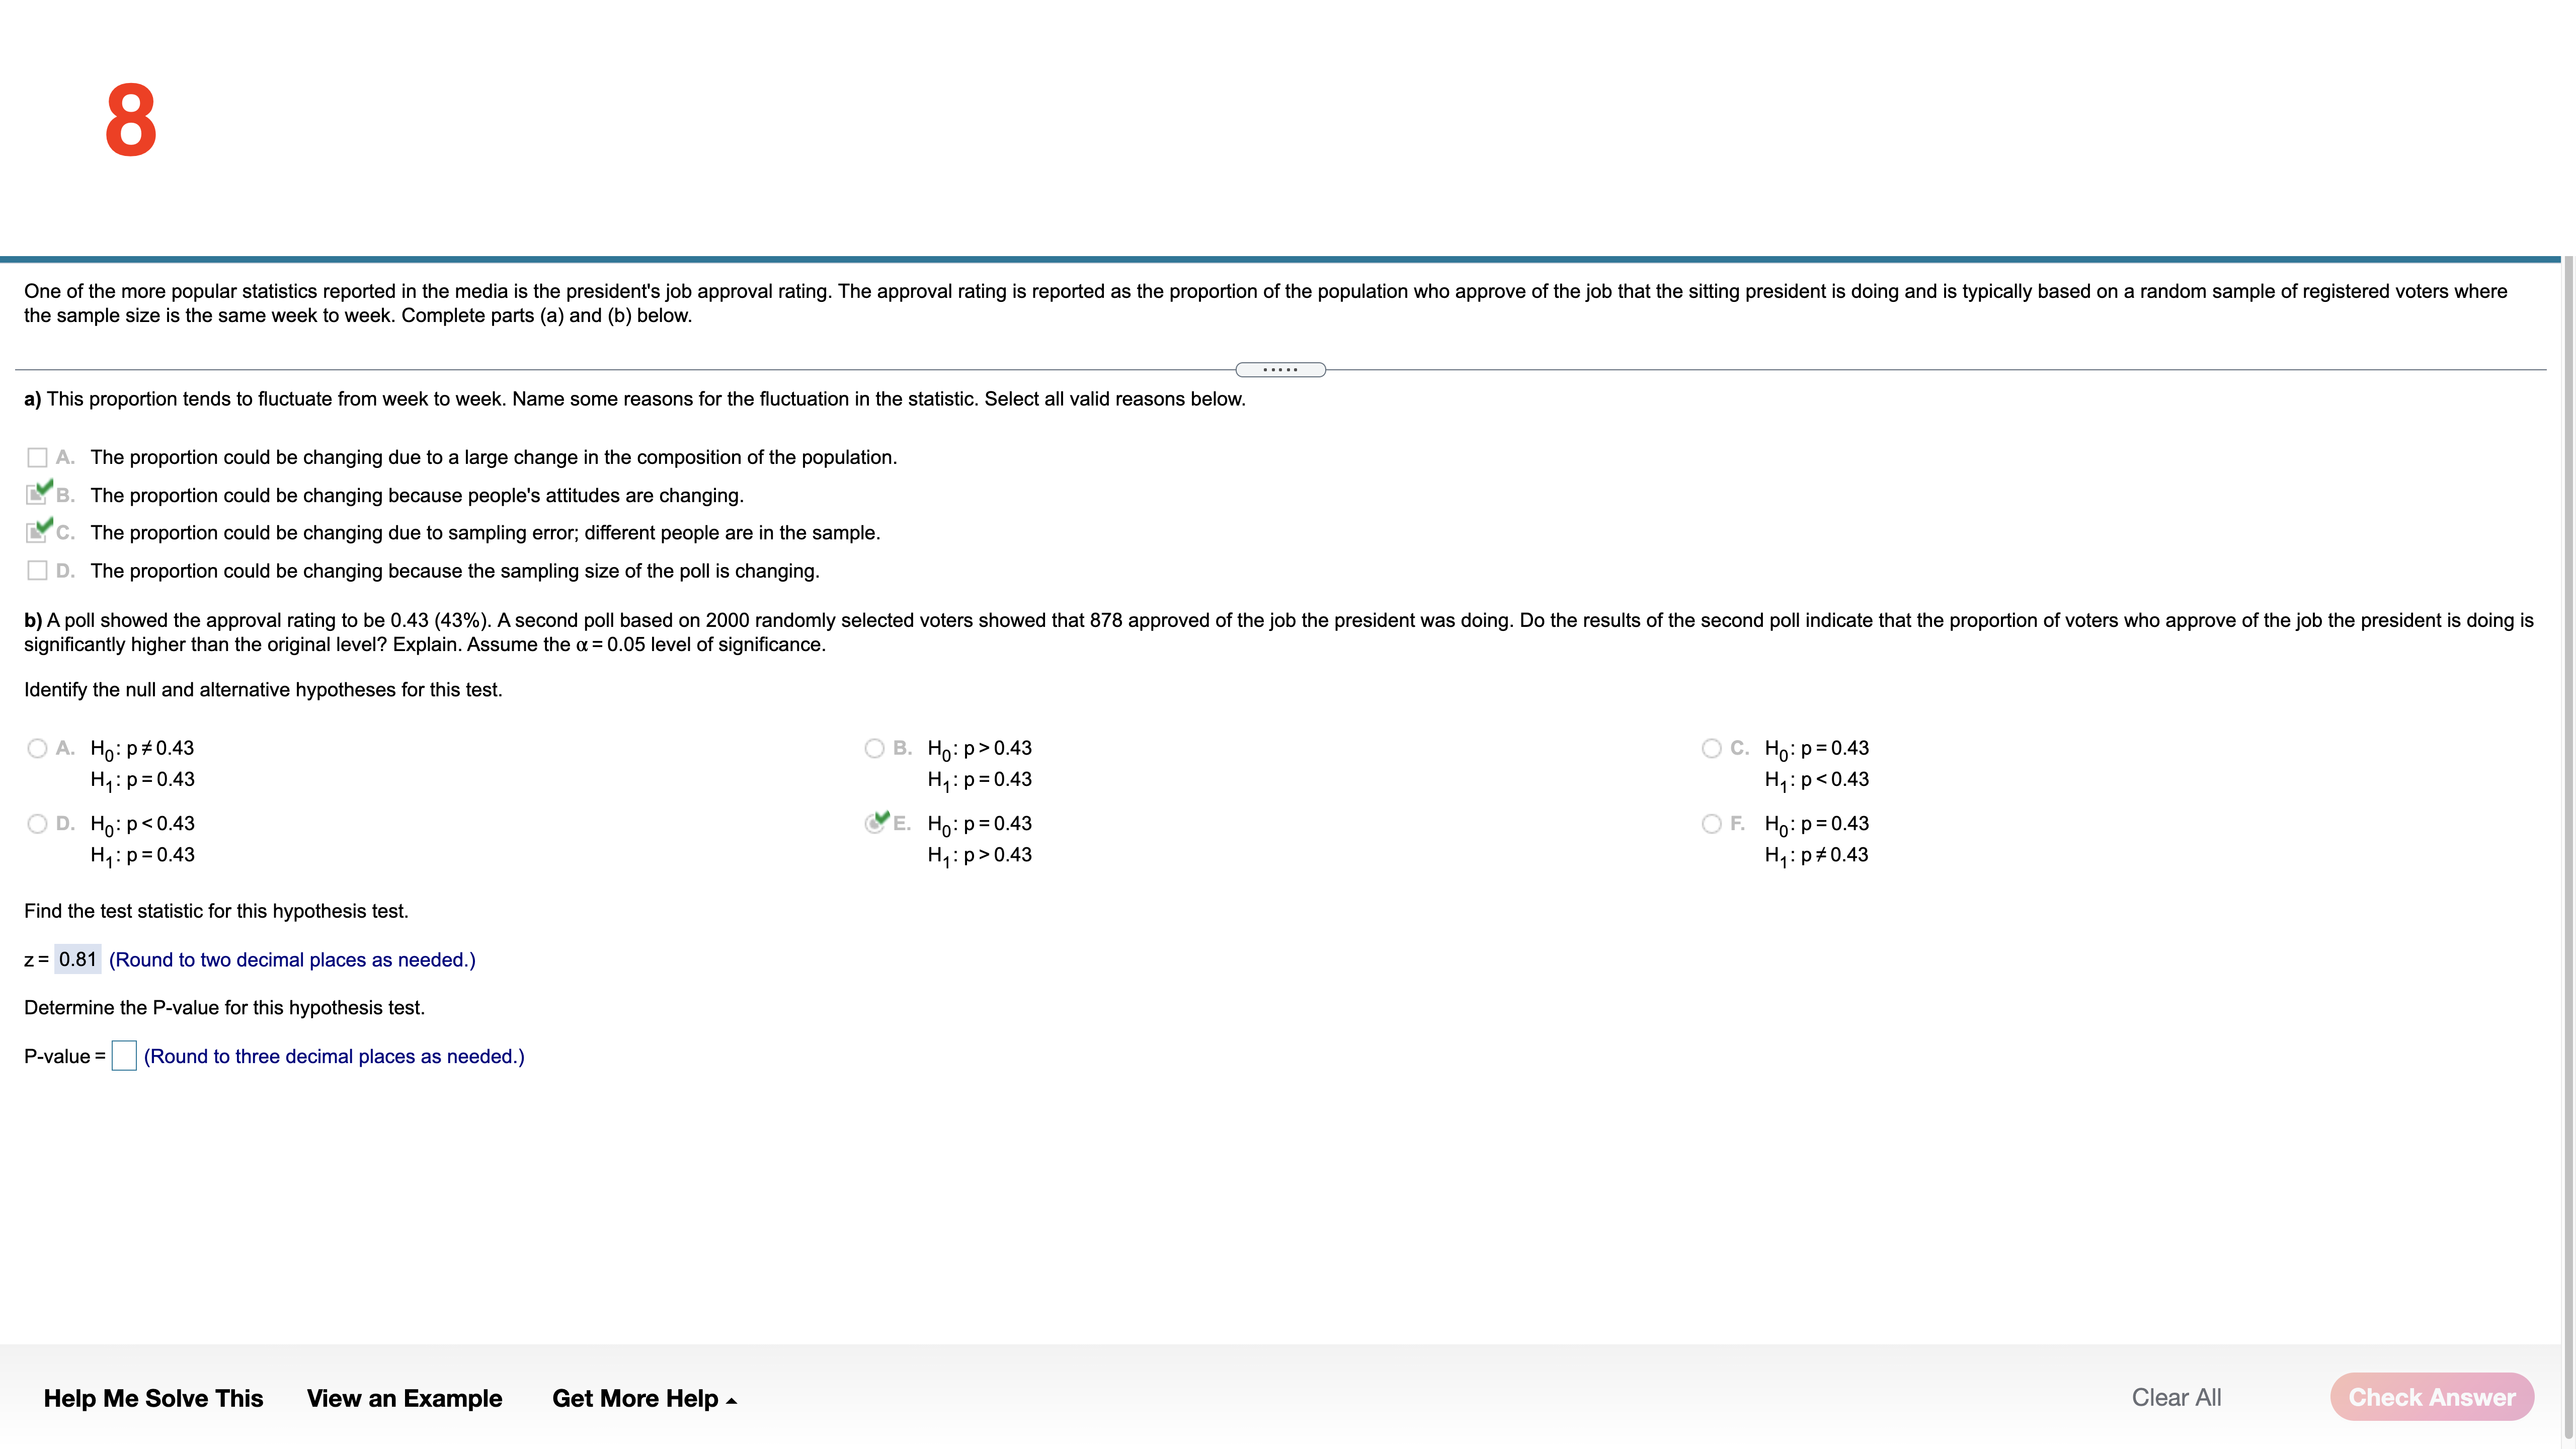
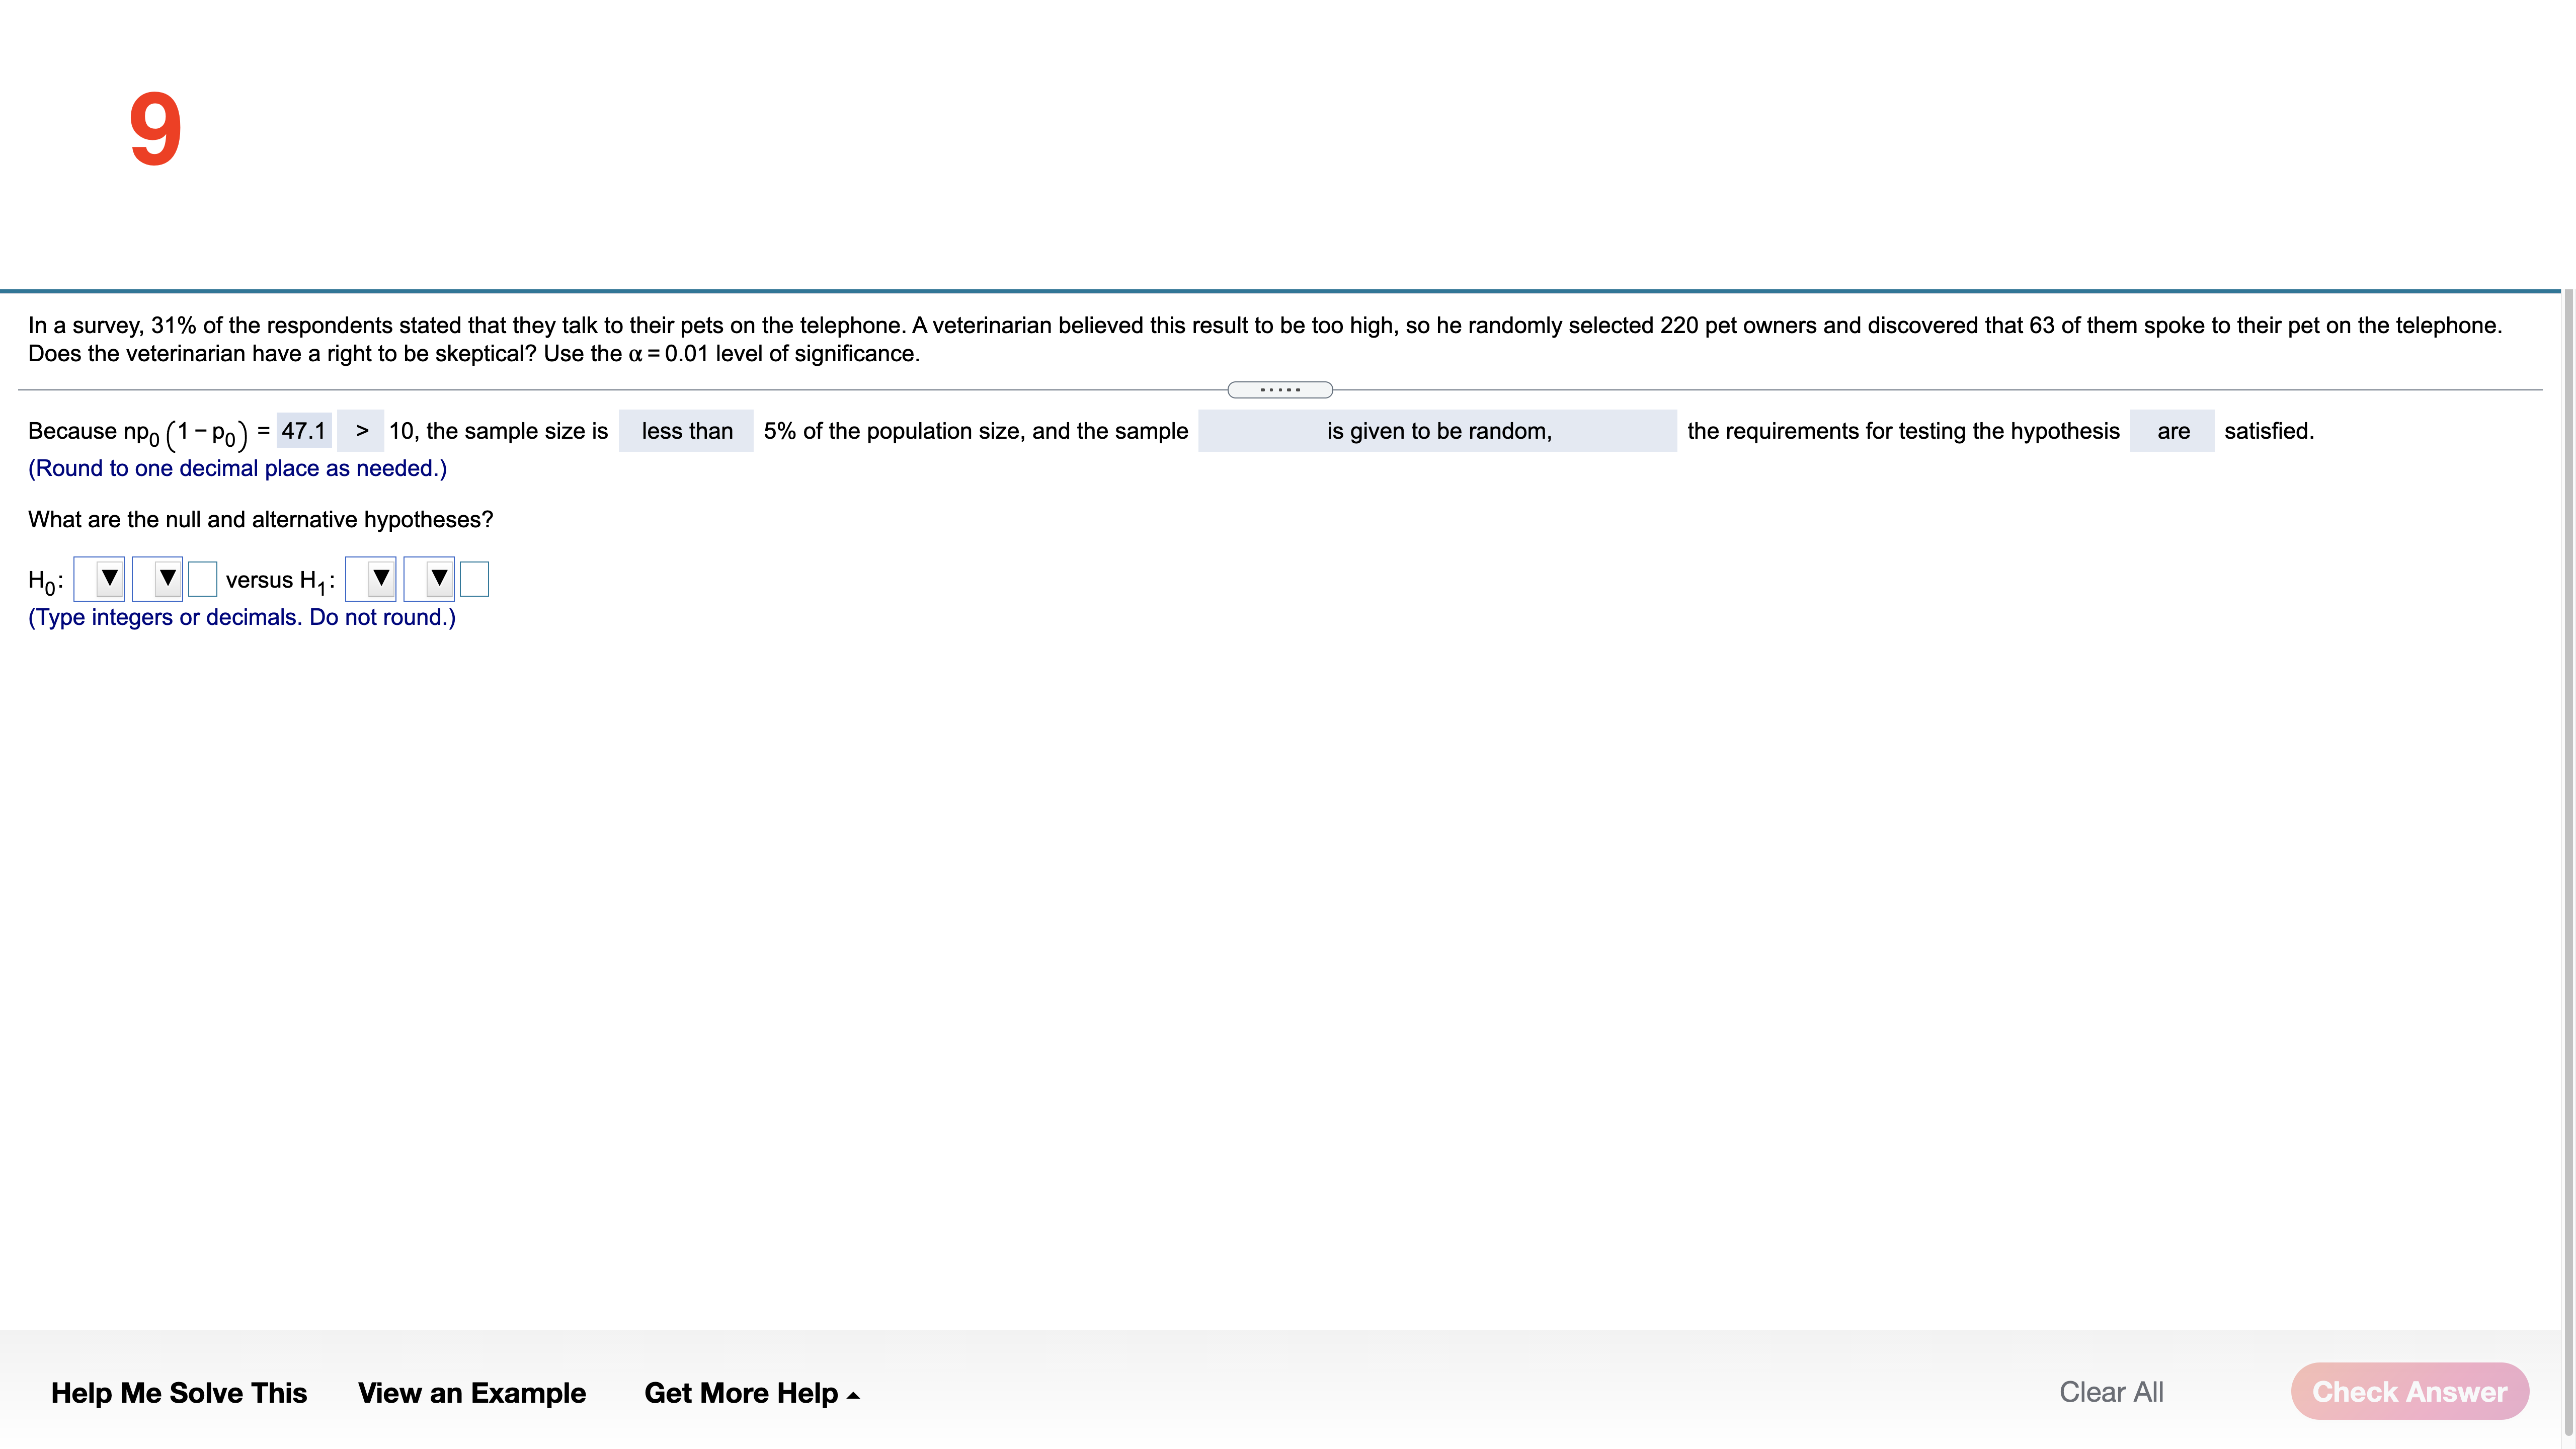
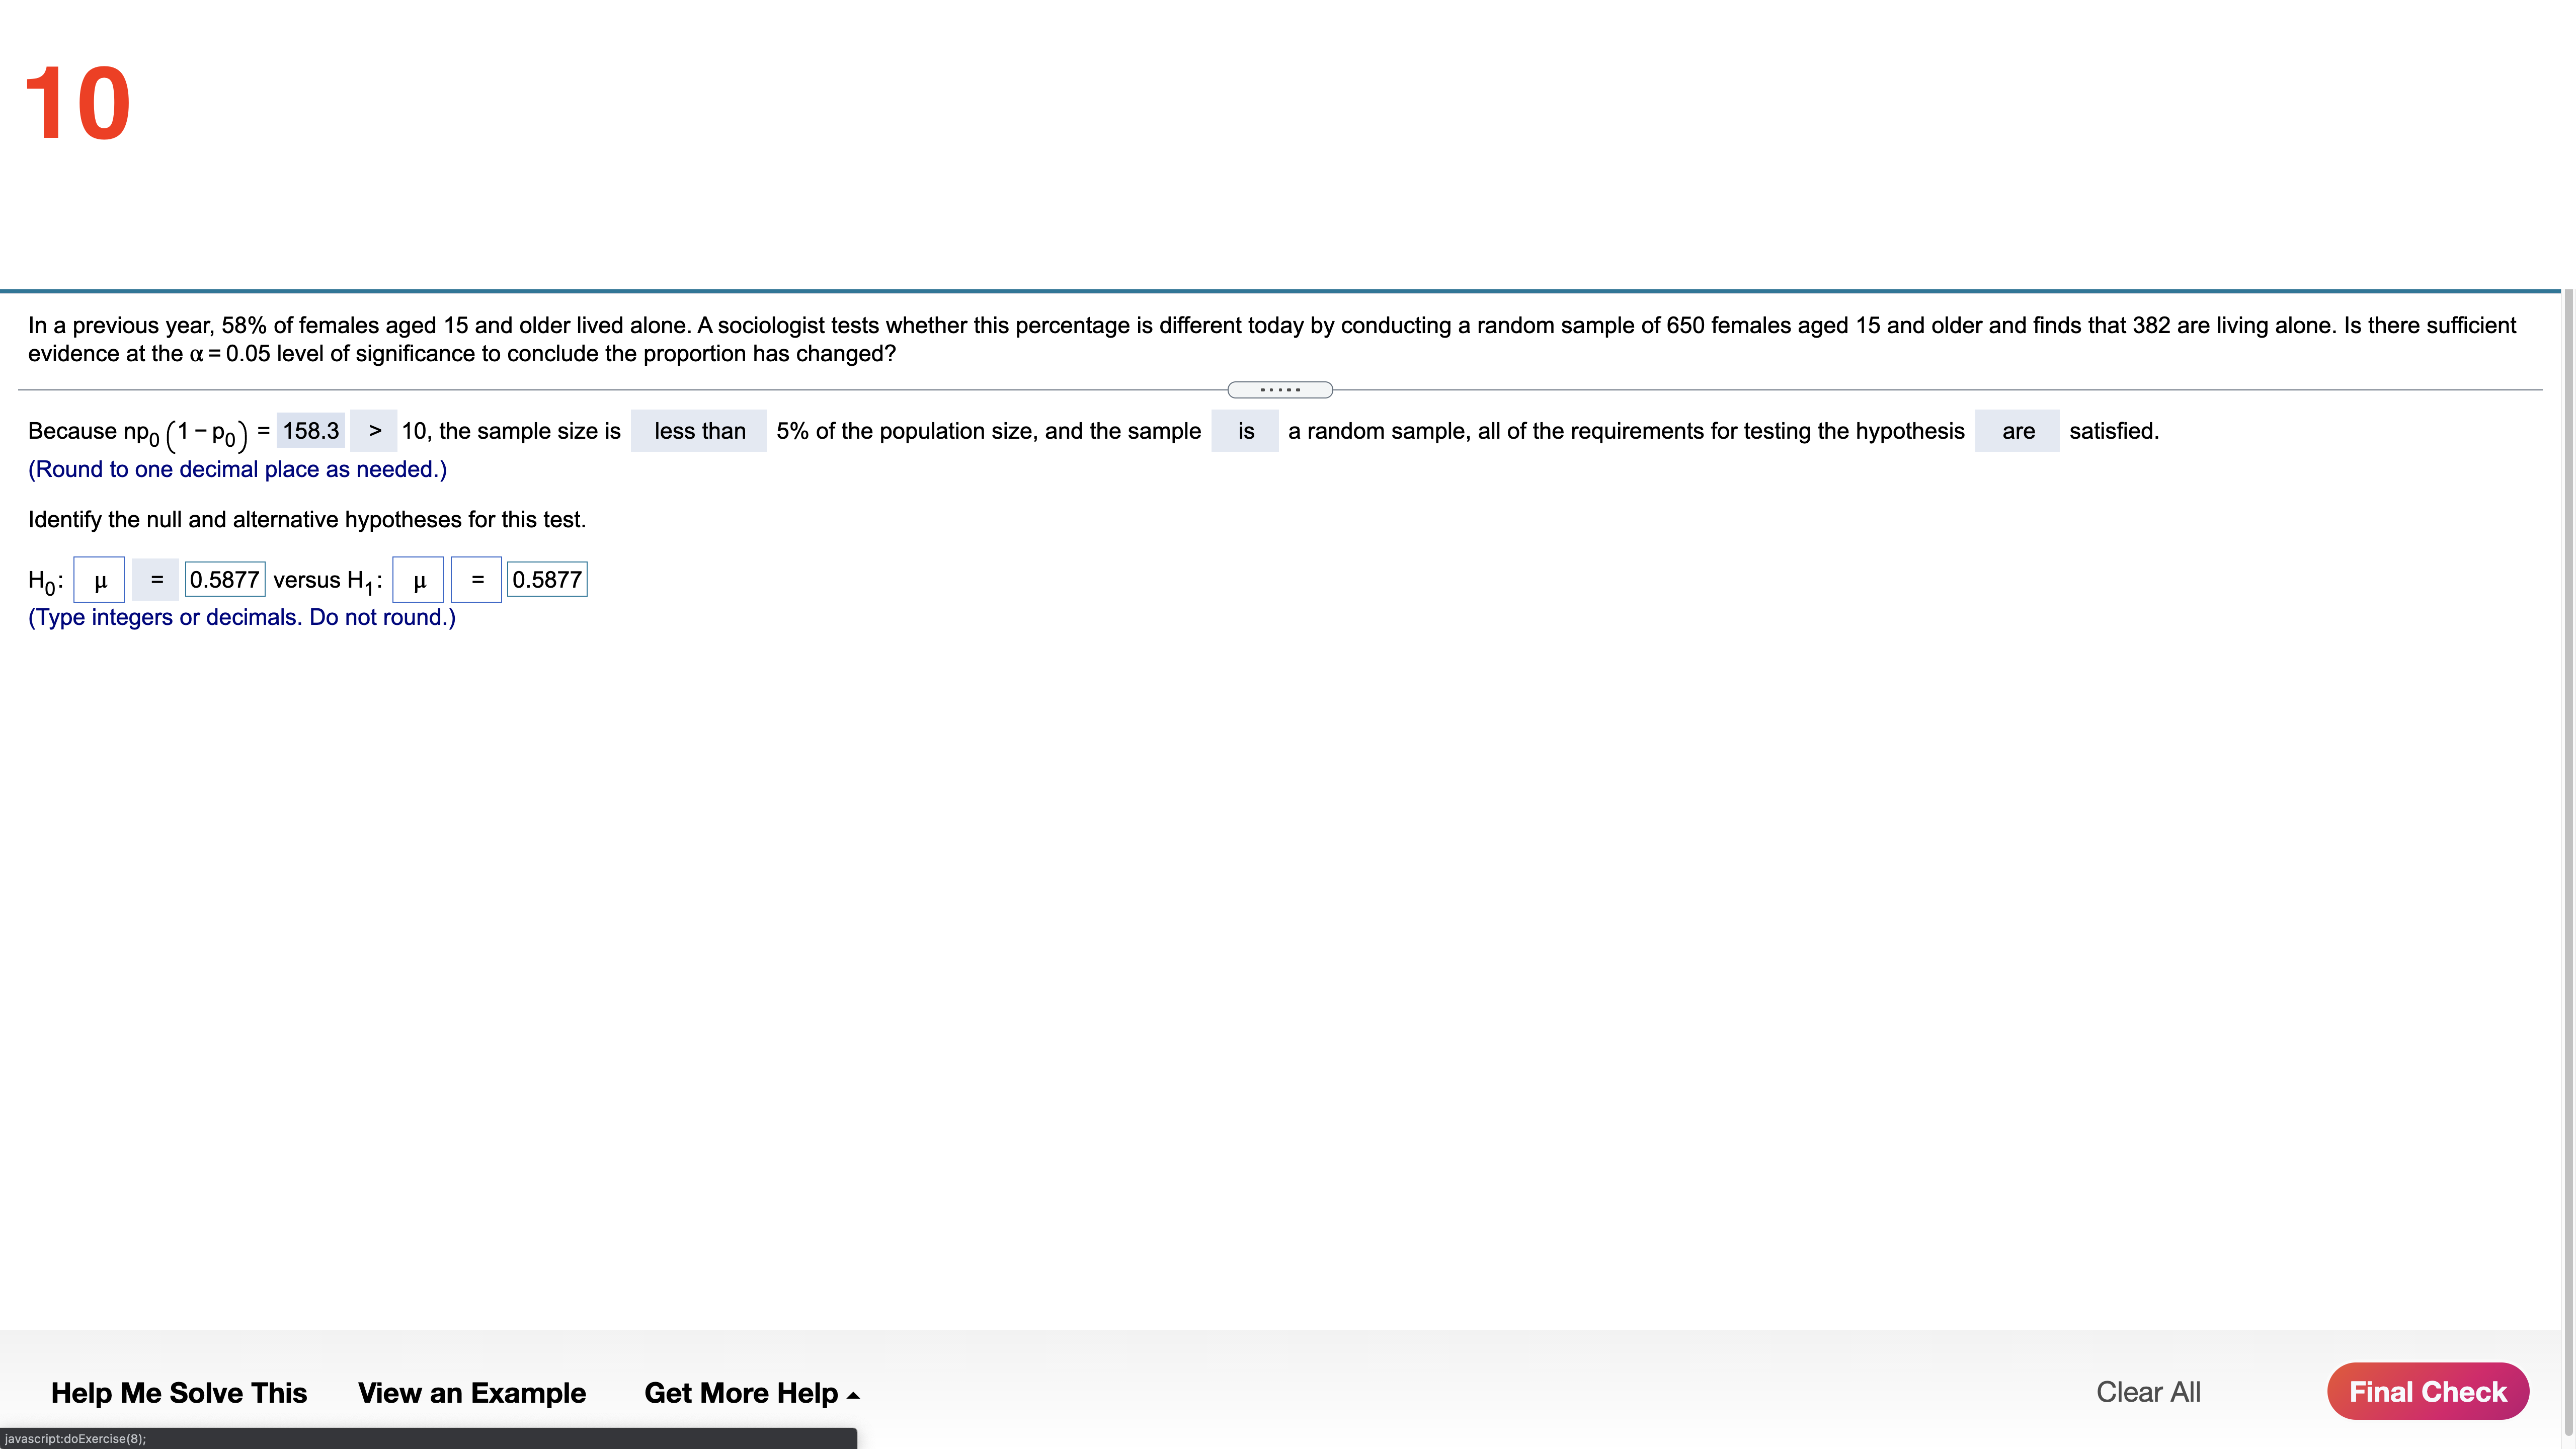
Determine the point estimate of the population proportion, the margin of error for the following confidence interval, and the number of individuals in the sample with the specified characteristic, x, for the sample size provided Lower bound = 0.192, upper bound = 0.648, n = 1500 The point estimate of the population proportion is 0.42 . (Round to the nearest thousandth as needed.) The margin of error is 0.228 (Round to the nearest thousandth as needed.) The number of individuals in the sample with the specified characteristic is. (Round to the nearest integer as needed.) Help Me Solve This View an Example Get More Help - Clear All Check Answer2 A survey of 2287 adults in a certain large country aged 18 and older conducted by a reputable polling organization found that 422 have donated blood in the past two years. Complete parts (a) through (c) below. Click here to view the standard normal distribution table (page 1). Click here to view the standard normal distribution table (page 2), (a) Obtain a point estimate for the population proportion of adults in the country aged 18 and older who have donated blood in the past two years. p= 0.185 (Round to three decimal places as needed.) (b) Verify that the requirements for constructing a confidence interval about p are satisfied. The sample a simple random sample, the value of Vis , which is 10, and the less than or equal to 5% of the (Round to three decimal places as needed.) is stated to not be is stated to not be sample proportion population proportion is stated to be greater than or equal to population size s stated to be sample size less than sample proportion cannot be assessed to be population proportion cannot be assessed to be 6 (1 -p) sample size can be assessed to be population size can be assessed to be no np (1-p) n X Vi (1,") More Help Me Solve This View an Example Get More Help - Clear All Check Answer2 screenshot 2 of 2 to show graphs. A survey of 2287 adults in a certain large country aged 18 and older conducted by a reputable polling organization found that 422 have donated blood in the past two years. Complete parts (a) through (c) below. Click here to view the standard normal distribution table (page 1). Click here to view the standard normal distribution table (page 2) (a) Obtain a point estimate for the population proportion of adults in the country aged 18 and older who have donated blood in the past two years. p= 0.185 (Round to three decimal p X X (b) Verify that the requiren Standard Normal Distribution Table (page 1) Standard Normal Distribution Table (page 2) The sample A (Round to three decimal p Standard Normal Distribution Standard Normal Distribution 0.00 0.01 0.02 0.03 0.04 0.05 0.06 0.07 0.08 0.09 z 0.00 0.01 0.02 O'O 0.04 0.05 0.06 0.07 0.08 0.09 0.0003 0.0003 3.000 0.0003 0.000 0.0003 0.000 0.0003 0.000 0.0002 28 0.5000 0.5040 0.5080 0.5120 0.5160 0.5199 D.5239 0.5279 0.5319 0.5359 -3.3 0.0005 0.0905 0.0004 0.0004 0.000 0.0004 0.0003 0.5398 0.543 0.5478 0.5517 0.5557 0.5596 0.5636 0.5675 0.5714 .5753 -3.2 0.0007 0.0006 0.0806 0.0906 0.0006 0.0006 0.000 0.0005 0.0095 0.2 0.5793 0.5832 0.5871 .5910 0.5948 0.5987 0.6026 0.6064 0.6103 0.6141 -3.1 0.0010 0.0609 0.0009 0.0608 0.0008 0.0008 0.0008 0 0907 0.0007 0.3 0.6179 0.6217 0.6255 0.6293 0.6331 0.6368 0.6406 16443 0.6480 0.6517 -3.0 .0013 0.0013 1.0013 0.0012 .0012 0.0011 0.0011 0.0011 0.0010 0.0010 0.4 0.6554 0.6591 0.6628 0.6664 0.6700 0.6736 0.6772 0.6808 0.6844 0.6879 -29 0.0019 0.0018 0.0018 0.0017 0.0016 0.0016 0.001 .0015 0.001 0.0014 0.5 0.6915 0.6950 0.6985 0.7019 0.7054 0.7088 0.7123 0.7157 0.7190 0.7224 -28 0.0025 D.002 0.0022 0.0021 0.0021 0.0020 0.6 0.7257 0.729 0.7324 0.735 0.7389 0.742 0.7454 07164 0.7486 0.7517 0.754 -2.7 0.0035 0.0034 0.003 .0030 0.0028 0.002 0.0026 0.7 0.7580 0.761 0.7642 0.7673 0.7823 0.7852 0.0052 0.7704 0.7734 0.7794 0.0647 0.0045 0.0043 0.0041 0.0040 0.0037 0.8 0.7881 0.7910 0.7939 0.7967 0.7995 0.8023 0.8051 0.8078 0.8106 0.8133 -2.5 .0062 0.0060 .0059 0.0057 .0055 0.0054 0.0052 0.0051 0.0049 0.0048 0.9 0.8159 0.8186 0.8212 0.8238 0.8289 0.8315 0.8340 0.8365 0.8389 0.0082 0.0080 0.0078 0.0075 0.0073 0.0071 0.006 0.006 0.006 0.0064 0.8413 0.8438 0.8461 0.8485 0.8508 0.8531 0.8554 0.8577 0.8599 0.8621 0.0107 0.0091 0.0087 0.8643 0.866 0.8686 0.8708 0.8729 0.8770 0.8790 6 01 36 0.874 0.8810 0.8830 -2.2 0.0139 0.0132 0.0119 0 0113 0.0110 0.8849 0.8888 0.890 0.8925 0.8944 0.8962 0.8980 0.8997 .90 15 0.0179 0.0174 0.0170 0.0166 0.0162 0.0158 0.0154 0.0150 0.0146 0.0143 0.9032 0.9049 0.9066 0.0082 0.9099 0.9115 0.9131 0.9147 0.9162 0.0137 -2.0 .0228 0.0222 0.0217 0.0212 0.0207 .0202 0.0197 .0192 0.0188 0.0183 0.9192 0.9207 0.9222 0.9236 0. 0751 0.9265 0.9279 0.9292 0.9306 0.9319 -1.9 0.0287 0.0281 0.0274 0.0268 0.0262 0.0256 0.0250 0.0244 0.0239 0.0233 0.9332 0.9345 0.9357 0.9370 0.9382 0.9394 0.9406 0.9418 0.9429 0.9441 -1.8 0.0359 0.0351 0.0344 0.0336 00322 0.0314 0.0301 0.0294 0.9452 0.946 0.9474 0.948 0.949 0.950 0.9525 0.9535 0.954 -1.7 0 0446 0.0436 0.042 0.0418 0.0409 0.0401 0.0392 0.0384 0.0375 0.0367 0.9554 0.956 0.9573 0.958 0.9591 0.959 0.9616 0.9625 0.9633 -1.6 0.0548 0.0516 0.0505 0.0495 0.0485 0.0475 1.8 0.9641 0.9649 0.9656 0.9664 0.0671 0.9678 0.9686 0.9693 0.9699 0.9706 -1.5 0.0668 0.0655 .0643 0.0630 0.0618 0.0606 0.0594 0.0582 0.0571 0.0235 0.0559 1.9 0.9713 0.9719 0.9726 0.9732 0.9738 0.9744 0.9750 0.9756 0.9761 0.9767 -14 0.0808 0.0793 0.077 0.0764 0.0749 0.0735 0.0721 ).0708 0.0694 0.0681 0.9772 0.9778 0.9783 0.9788 0.9793 0.9798 0.9803 0.980 0.9812 0.9817 0.0968 0 0951 0.0934 0.0853 0.9821 0.982 0.9830 0.9834 0.9838 0.984 0.9846 0.9850 0.9854 0.9857 -1.2 0.1151 0.1131 0.1093 0.107 0.1056 0.1038 0 1903 0.0985 2.2 0.9861 0.9864 0.9868 0.987 0.987 0.9884 0.9887 0.9890 -1.1 0.1357 0.1335 0.1314 0.1292 0.1251 0.1230 0.1190 0.1170 2.3 0.9893 0.980 0.9898 0.900 0.9906 0.9909 0.9911 0.9913 0.9916 -1.0 .1587 0.1562 0.153 0.1515 0.1492 0.1469 0.1446 0.1210 0.1423 .1401 0.1379 2.4 0.9918 0.9920 0.9922 0.9925 0.9927 0.9929 0.9931 0.9932 0.9934 0.9936 -0.9 0.1841 0.1814 0.1788 0.1762 0.173 0.1711 0.1685 0.1660 0.163 0.1611 2.5 0.9938 0.9940 0.9941 0.9943 0.9945 0.9946 0.9948 0.9949 0.9951 0.9952 -08 02119 0.2090 0.206 0.2033 0.1977 0.1949 0.189 0.1867 2.6 0.9953 0.995 0.9956 0.995 0.9959 0.996 0.996 0.9962 0.9963 0.996 -0.7 0320 0.2389 0.235 0.2327 0.2296 0.2266 03236 0.2206 0.2177 2.7 0.9965 0.9966 0.9967 0.996 0.9969 0.997 0.9971 0.9972 0.9973 0.9974 -0.6 0.2743 0.2676 0.2643 0.2611 0.2578 02314 0.2465 2.8 0.9074 0.907 0.9876 0.9977 0.9977 0.9978 0.9979 0.9979 0.9980 0.9081 -0.5 0.3085 0.3050 .3015 0.2981 0.2946 .2912 0.2877 2843 0.2810 0.2776 2.9 0.9981 0.998 0.9982 0.9983 0.9984 0.9984 0.9985 0.9985 0.9986 0.9986 -04 3446 0.3409 0.337 0.3336 0.330 0.3264 0.3228 0.3192 0.3156 0.3121 0.9987 .9987 0.9987 0.9988 0.9988 0.9989 0.998 0.998 0.9990 0.9990 -0.3 0.3821 0.3745 363 0.359 0.3557 0.3520 0.3483 0.9990 0.999 0.9991 0.9091 0.9992 0.999 0.9992 0.9992 0.9993 0.9993 -0.2 0.4129 0.4090 0.3974 0 3807 0.9993 .9993 0.9994 0.909 0.9994 0.999 0.9994 0.9995 0.9995 0.9995 -0.1 0.4602 0.452 0.4443 0.4404 0.4364 0.4325 0.4247 0.9095 0.9095 0.9995 0.9096 0.9996 0.9996 0.9996 0.9996 0.9096 0.9997 -0.0 0.5000 0.4960 .4920 0 4880 0.4840 0.4801 4761 0.4721 4681 D.4641 0.9997 0.9097 0.9097 0.9997 0 9097 0.9997 0.9097 0.9997 0.9997 0.9998 z 0.00 0.01 0.02 0.03 0.04 0.05 0.06 0.07 0.08 0.09 0.00 0.01 0.02 0.03 0.04 0.05 0.06 0.07 0.08 0.09 Help Me Solve This Print Done Print Done Clear All Check Answer3 The trade magazine QSR routinely checks the drive-through service times of fast-food restaurants. A 90% confidence interval that results from examining 649 customers in Taco Bell's drive-through has a lower bound of 156.2 seconds and an upper bound of 159.2 seconds. Complete parts (a) through (c). (a) What is the mean service time from the 649 customers? The mean service time from the 649 customers is 157.7 seconds (Type an integer or a decimal. Do not round.) (b) What is the margin of error for the confidence interval? The margin of error is 1.5 seconds. (Type an integer or a decimal. Do not round.) (c) Interpret the confidence interval. Select the correct choice below and fill in the answer boxes to complete your choice. (Type integers or decimals. Do not round.) O A. The mean drive-through service time of Taco Bell is seconds % of the time. O B. There is a % probability that the mean drive-through service time of Taco Bell is between seconds and seconds. O C. One can be % confident that the mean drive-through service time of Taco Bell is seconds O D. One can be % confident that the mean drive-through service time of Taco Bell is between seconds and seconds. Help Me Solve This View an Example Get More Help - Clear All Check Answer4 The following data represent the pH of rain for a random sample of 12 rain dates. A normal probability plot suggests the data could come from a population that is normally distributed. A boxplot indicates there are no outliers. Complete parts a) through d) below. 5.58 5.72 5.24 4.80 5.02 4.5 A 76 4.74 5.19 4.61 4.56 : 69 Click the icon to view the table of critical t-values. (a) Determine a point estimate for the population mean. - X A point estimate for the population mean is 5.04 . Table of Critical t-Values (Round to two decimal places as needed.) (b) Construct and interpret a 95% confidence interval for the mean pH of rainwater. Select the correct choice below and fill in the answer boxes to complete your choice. cending order. Round to two decimal places as needed.) JA. There is 95% confidence that the population mean pH of rain water is between and. O B. There is a 95% probability that the true mean pH of rain water is between and right tai O C. If repeated samples are taken, 95% of them will have a sample pH of rain water between |and. f-Distribution Degrees of Area in Right Tai Freedom 0.25 0.20 0.15 0.10 0.05 0.025 0.02 0.01 0.005 0.0025 0.001 0.0605 1.000 1376 1963 3.078 2.706 27.32 8.309 0.816 22.32 31.59 10.21 12.924 2:571 3.365 5893 0.718 2.447 5.208 5.959 3.169 2.632 0.675 2 581 0674 1282 2 326 2 576 3.090 Degrees of 0.25 0.20 0.15 0.10 0.05 0.025 0.02 0.01 0.005 0.0025 0.001 0.0605 Freedom 1-Distribution Area in Right Tail Help Me Solve This View an Example Get More Help - Clear All Check Answer5 The data shown below represent the repair cost for a low-impact collision in a simple random sample of mini- and micro-vehicles (such as the Chevrolet Aveo or Mini Cooper). Complete parts (a) through (c). $3147 $1043 $728 $634 $784 $1710 $3326 $2080 $2662 $1357 Click here to view page 1 of the standard normal distribution table. Click here to view page 2 of the standard normal distribution table. Click here to view the table of critical t-values. (a) Draw a boxplot to check for outliers. Choose the correct answer below. O A. B VC OD Q 0 2000 4000 0 2000 4000 2000 4000 0 2000 4000 (b) Construct and interpret a 95% confidence interval for the population mean cost of repair. Does the boxplot suggest that it is reasonable to construct a confidence interval for the population mean? A. Yes, the distribution is roughly symmetric and there are no outliers. O B. No, the distribution is roughly symmetric with no outliers. O C. No, the boxplot shows there are outliers. O D. Yes, the distribution is highly skewed with outliers. If the boxplot suggests a confidence interval can be constructed, calculate and interpret the lower bound and the upper bound of the confidence interval. Select the correct choice below and, if necessary, fill in the answer boxes to complete your choice. (Round to the nearest dollar. Use ascending order.) A. We are 95% confident that the mean cost of repair is between $ 1022 and $ 2473. O B. There is a 95% probability that the mean cost of repair is between $ and $ O C. The confidence interval should not be constructed. (c) Suppose you obtain a simple random sample of size n = 10 of a Mini Cooper that was in a low-impact collision and determine the cost of repair. Do you think a 95% confidence interval would be wider or narrower? Explain. O A. Narrower, because there is less variability in the data because any variability caused by the different types of vehicles has been removed. O B. Wider, because there is more variability in the data because variability in the repair cost of the car has been added. C. Narrower, because taking a second random sample will always lead to a narrower confidence interval. O D. Wider, because taking a second random sample will always lead to a wider confidence interval. Help Me Solve This View an Example Get More Help - Clear All Final Check5 (part 2 of screenshot 5 to show graphs). The data shown below represent the repair cost for a low-impact collision in a simple random sample of mini- and micro-vehicles (such as the Chevrolet Aveo or Mini Cooper). Complete parts (a) through (c). $3147 $1043 $728 $634 $784 $1710 $3326 $2080 $2662 $1357 Click here to view page 1 of the standard normal distribution table. - X - X Standard Normal Distribution Table (Page 1) Standard Normal Distribution Table (Page 2) Table of Critical t-Values Area right tai Table VII f-Distribution Table V (continued) Area in Right Tail Table V Degrees of Freedom 0.25 0.20 0.15 0.10 0.05 0.025 0.02 0.01 0.005 0.0025 0.001 0.0605 Standard Normal Distribution Standard Normal Distribution 0.00 0.01 0.02 0.03 0.04 0.05 0.06 0.07 0.08 0.09 0.00 0.01 0.02 0.03 0.04 0.05 0.06 0.07 0.08 0.09 1.000 12.706 31.821 63.657 127.32 1 318.309 636.619 2:920 22.327 31.599 - 3. 0.0003 0.0605 0.0003 0.0003 0.0003 0.0003 0.0603 0.0003 0.000 9.0802 0.0 0.5000 0.5040 0.5080 0.5120 0.5160 0.5199 0.5239 0.5279 0.5319 0.5359 0.741 0.978 2.355 10:215 0.0005 0.0005 0.0005 0.0604 0.0004 0.0004 0.0004 0.0004 0.0004 0.0003 0.5398 0.5478 0.5517 0.5557 0.5596 0.5636 0.5714 0.5753 0.727 4.773 -3.2 0.0007 0.0007 0.0006 0.0606 0.0006 0.0006 0.0006 0.0005 0.0005 0.0005 0.5793 0.5832 0.5871 0.5910 0.5948 0.5987 0.6026 0.6064 0.6103 0.6141 0.718 4.317 1.0010 0.0009 .0009 0.0009 0.0008 0.0008 0.0008 0.0008 0.0007 .0007 0.6179 0.6217 0.625 0.6293 0.6331 0.6368 0.6406 0.6443 0.6480 0.6517 - 30 1.0013 0.0013 0.0013 0.0012 0.711 0.0012 0.0011 0.0011 0.0011 0.0010 0.0010 0.4 0.6554 0.6591 0.6628 0.6664 0.6700 0.6736 0.6772 0.6808 0.6844 0.6879 0.0619 0.0618 0.0018 0.0017 0.0016 0.0016 0.0015 0.0015 0.0014 0.0014 0.5 0.6915 0.6950 0.6985 0.7019 0.7054 0.7088 0.7123 0.7157 0.7190 0.7224 0.0026 0.0025 0.0024 0.0023 0.0023 0.0022 0.0821 0.0021 0.0020 0.0019 0.6 0.7257 0.7291 0.732 0.7357 0.7389 0.7422 0.7454 0.7486 0.7517 0.754 -2.7 0.0035 0.0034 0.003 0.0032 0.0031 0.0030 0.0028 0.0826 0.7 0.758 0.7611 0.764 0.7673 0.7704 0.7734 0.7764 0.7794 7823 0.7852 -2.6 0.0047 0.0045 0.004 0.0043 0.0041 0.0040 0.0039 0.0038 0.003 0.0036 0.8 0.7881 0.7910 0.793 0.7967 0.7995 0.8023 0.8051 0.8078 0.8106 0.8133 -25 0.0062 0.0060 0.0059 0.0057 0.0035 0.0054 0.0052 0.0051 0.0049 0.0048 0.9 0.8159 0.8186 0.8212 0.8238 0.8264 0.8289 0.8315 0.8340 0.8365 0.8389 -2.4 0.0082 0.0080 0.0078 0.0075 0.0673 0.0069 0.0068 0.0066 0.0064 1.0 .8413 0.8438 0.8461 0.8485 0.8508 0.8531 0.8554 0.8577 0.8599 0.8621 3252 -2.3 .0107 0.0104 0.0102 0.0099 0.0096 0.0094 0.0091 0.0089 0.0087 0.0084 1.1 0.8643 0.8665 0.8686 0.8708 0.8729 0.874 0.877 0.8790 .8810 0.8830 -22 0.0139 0.0136 0.0132 0.0125 0.0122 0.0119 0.0116 0.0113 ).0110 1.2 0.8849 0.888 0.8907 0.8925 0.8944 0.896 0.898 0.8997 0.9015 ).0179 0.0174 0.0170 ).0166 0.0162 .0158 0154 0.0150 0.0143 .9032 0.9049 0.906 0.9082 0.9099 0.9115 0.9131 0.9147 0.9162 0.9177 -2.0 ).0228 0.0222 0.0217 0.0212 0.0207 0.0202 10197 ).0192 0.0188 0.0183 1.4 .9192 0.9207 .9222 0 9236 0.9251 0.9265 0.9279 0.9292 .9306 0.9319 -1.9 0.0267 0.0281 0.0274 0.0268 0.0262 0.0256 0.0250 0.0244 0.0239 0.0233 1.5 0.9332 0.9345 0.9357 0.9370 0.9382 0.9394 0.9406 0.9418 0.9429 0.9441 0.0359 0.0351 0.0344 0.0336 0.0329 0.0322 0.0314 0.0307 0.0301 0.0294 0.9452 0.947 0.9484 0.9495 0.9505 0.9515 0.9525 0.9535 0.9545 -1.7 1.6 0.9463 0.0446 0.0436 0.042 0.0418 0.0409 0.0401 0.0392 0.0384 0.0367 0.9554 0.9564 0.957 0.9582 0.959 0.9599 0.960 0.9625 0.9633 -1.6 0.0548 0.0537 0.0526 0.0516 0.0505 0.0495 0.0485 0.0475 0.046 0.0455 1.8 0.964 0.9649 0.965 0.9664 0.9671 0.9678 0.9686 0.9693 0.9699 0.9706 -15 0.0668 0.0655 0.0643 0.0630 0.0618 0.0606 0.0594 0.0582 0.057 0.0559 1.9 0.9713 0.9719 0.9726 0.9732 0.9738 0.9744 0.9750 0.9756 0.9761 0.9767 -1.4 0.0808 -1.3 0.0623 0.076g 0.0749 0.0735 0.0621 0.0708 0.0694 0.9772 0.9778 0.9783 0.9788 0.9793 0.9798 0.9803 0.9808 0.9812 0.9817 .0968 0.0951 0.0934 0.0918 0.0901 0.0885 0.0869 ).0853 0.0651 0.0838 0.0823 0.982 0.9826 0.983 0.9834 0.9838 0.9842 0.9846 0.9850 .9854 0.9857 -1.2 0.1151 0.1131 0.1112 0.1093 0.107 0.1056 0.1038 0.1020 0.1003 0.0985 0.9861 0.9864 0.986 0.9871 0.9875 0.9878 0.9881 0.988 0.9887 0.9890 -1.1 .1357 0.1335 .1314 0.1292 0.127 0.1251 0.1230 0.1210 0.119 .1170 0.9893 0.9896 0.989 0.9901 0.9904 0.9906 0.9909 0.9911 0.9913 0.9916 -10 ).1587 0.1562 .1539 0.1515 0. 149 0.1469 ).1446 0.1423 0.1401 ).1379 .9918 0.9920 0.9922 0.9925 .9927 0.9929 0.9931 0.9932 .9934 0.9936 0.1841 0.1814 0.1788 0.1762 0.1736 0.1711 0.1685 0.1635 0.9938 0.9940 0.9941 0.9943 0.9945 0.9946 0.9948 0.9949 0.9951 0.9952 .2119 0.2090 0.2061 0.2033 0.2005 0.1977 0.1949 0.1922 0.189 0.1867 0.9953 0.9955 0.995 0.9957 0.995 0.9960 0.9961 0.9962 0.9963 0.9964 -0.7 0.2420 0.2389 0.2327 02296 0.2206 0.217 0.2148 0.9965 0.9966 0.996 0.9968 0.996 0.9970 0.9971 0.9972 0.9973 0.9974 0.2743 0.2709 0.2676 0.2643 0.261 0.2578 0.254 0.2514 0.248 0.2451 0.9974 0.9975 0.997 0.9977 0.9977 0.9978 0.997 0.9979 0.9980 0.9981 -0.5 .3085 0.3050 0.3015 0.2981 0.2946 0.2912 0.2877 0.2843 0.2810 0.2776 0.9981 0.9982 0.9982 0.9983 0.998 0.9984 0.9985 0.9985 0.9986 0.9986 -0.4 0.2846 0.3409 0.3372 0.3736 0.3300 0.3264 0.3228 0.3192 0.3156 0.3121 0.9987 0.9987 0.9987 0.9988 0.9988 0.9989 0.9989 0.9989 0.9990 0.9990 0.3821 0.3745 0.3707 0.3632 0.3594 0.3557 0.3520 0.3483 0.9990 0.9991 0.999 0.9991 0.9992 0.9992 0.9992 0.9992 0.9993 0.9993 -0.2 0.5783 0.4207 0.4168 0.4129 0.560% 0.4090 0.4052 0.4013 0.3974 0.3936 0.3897 0.3859 0.9993 0.9994 0.9994 0.9994 0.9994 0.9994 0.9995 0.9995 0.9995 299 92929 8 0.4602 0.4562 0.4522 0.4483 0.4443 0.4404 0.4364 0.4325 0.4286 0.4247 0.9995 0.9995 0.9996 0.9996 0.9996 0.9996 0.9996 0.9996 0.9997 -0.0 8 8 2838 0.5000 0.4960 0.4920 0.4880 0.4840 0.4801 0.4761 0.4721 0.4681 0.4641 0.9997 0.9997 .9997 0.9997 0.9997 0.9997 0.9997 0.9997 0.9997 0.9998 282 Print Done Print Done Print Done Help Me Solve This View an Example Get More Help - Clear All Final Check6 The trade volume of a stock is the number of shares traded on a given day. The data in the first accompanying table, in millions (so that 6.16 represents 6, 160,000 shares traded), represent the volume of a PepsiCo stock traded for a random sample of 38 trading days in 2018. A second random sample of 38 days in 2018 resulted in the data in the second accompanying table. Complete parts (a) through (d). Click here to view the data for sample 1 Click here to view the data for sample 2. Click here to view the table of critical t-values Table of Critical t-Values (a) Use the data from sample 1 to compute a point estimate for the population mean number of shares traded per day in 2018. A point estimate for the population mean number of PepsiCo shares traded per day in 2018 is 5.54 million. - Arca in right tail (Round to two decimal places as needed.) (b) Using the data from sample 1, construct a 95% confidence interval for the population mean number of shares traded per day in 2018. Interpret the confidence interval. Select the correct choice below and fill in the answer boxes to complete your choice. Table VII (Round to two decimal places as needed.) f-Distribution O A. The number of shares of PepsiCo stock traded per day is between million and million for % of all days in 2018. Degrees of Area in Right Tail Freedom 5 0.20 0.15 50.10 0.05 0.025 0.02 0.01 0.005 0.0025 0.001 0.0605 O B. There is a % probability that the population mean number of shares of PepsiCo stock traded per day in 2018 is between million and million. 1.000 3.078 15.894 2.920 12.706 4.849 31.821 63.657 IZEzZ $18.309 636.619 O C. One can be % confident that the number of shares of PepsiCo stock traded in all days of 2018 is between million and million. 0.816 14.089 0.765 2353 4.303 7453 22.32 10.215 31.59 12.924 O D. One can be % confident that the population mean number of shares of Pepsico stock traded per day in 2018 is between million and million. 0.741 0.941 2132 3.182 2.999 8:604 5.598 2173 2.015 8.610 0.727 1.156 2.571 2.757 8 8 8 4.773 5.893 6.869 2.612 4.317 5.208 5.959 3.833 501 2.398 4.297 2.228 2.359 3.581 4.587 2.201 2.328 3.497 4.025 4.437 2.179 3.428 3.930 3-372 4.221 X X 3. 286 3.733 4.073 Sample 1 Volumes (millions) Sample 2 Volumes (millions) 2.235 3.252 3.686 4.015 3.222 3.646 Sample 1 Sample 2 3.850 6.16 4.16 5.12 4.89 3.819 4.98 7.54 10.96 5.55 8.88 8.57 5.27 4.28 7.56 3.65 7.65 3:725 7.28 6.10 6.89 4.96 6.39 4.00 5.73 3.79 4.02 6.22 6.34 4.54 4.35 4.64 3.65 4.85 6.69 6.96 4.80 8.13 5.32 6.71 5.08 5.75 NNN NNNNNNNNNN NNNNNNNNNN FAMED ACCESS 5.05 4.84 6.85 5.46 4.95 4.13 5.90 4.81 4.42 6.69 3.25 6.23 8.37 7.84 4.92 7.71 5.00 6.04 4.97 7.29 5.44 6.58 5.07 3.94 7.76 6.74 4.80 5.04 5.99 4.37 6.92 2.42 3.71 Print Done Print Done Print Done Help Me Solve This View an Example Get More Help - swer7 The trade magazine QSR routinely checks the drive-through service times of fast-food restaurants. A 95% confidence interval that results from examining 519 customers in Taco Bell's drive-through has a lower bound of 156.2 seconds and an upper bound of 160.0 seconds. Complete parts (a) through (c). (a) What is the mean service time from the 519 customers? The mean service time from the 519 customers is 158.1 seconds (Type an integer or a decimal. Do not round.) (b) What is the margin of error for the confidence interval? The margin of error is seconds (Type an integer or a decimal. Do not round.) Help Me Solve This View an Example Get More Help - Clear All Check Answer8 One of the more popular statistics reported in the media is the president's job approval rating. The approval rating is reported as the proportion of the population who approve of the job that the sitting president is doing and is typically based on a random sample of registered voters where the sample size is the same week to week. Complete parts (a) and (b) below. a) This proportion tends to fluctuate from week to week. Name some reasons for the fluctuation in the statistic. Select all valid reasons below. A. The proportion could be changing due to a large change in the composition of the population. Ly B. The proportion could be changing because people's attitudes are changing. Y C. The proportion could be changing due to sampling error; different people are in the sample. D. The proportion could be changing because the sampling size of the poll is changing b) A poll showed the approval rating to be 0.43 (43%). A second poll based on 2000 randomly selected voters showed that 878 approved of the job the president was doing. Do the results of the second poll indicate that the proportion of voters who approve of the job the president is doing is significantly higher than the original level? Explain. Assume the a = 0.05 level of significance Identify the null and alternative hypotheses for this test. O A. Ho: P #0.43 O B. Ho: P > 0.43 O C. Ho: P = 0.43 H1: p= 0.43 H1 : p = 0.43 H1: p 0.43 H1: p #0.43 test statistic for this hypothesis test. z= 0.81 (Round to two decimal places as needed.) Determine the P-value for this hypothesis test. P-value = (Round to three decimal places as needed.) Help Me Solve This View an Example Get More Help - Clear All Check Answer9 In a survey, 31% of the respondents stated that they talk to their pets on the telephone Aveterinarian believed this result to be too high. so he randomly selected 220 pet owners and discovered that 63 of them spoke to their pet on the telephone Does the veterinarian have a right to be skeptical? Use the a = 0.01 level of signicance. Because npo (1 - p0) = 47.1 > 10, the sample size is less than 5% of the population size, and the sample is given to be random, the requirements for testing the hypothesis are satised. (Round to one decimal place as needed.) What are the null and alternative hypotheses? H0: V V versusH1: V V (Type integers or decimals. Do not round.) Help Me Solve This View an Example Get More Help A Clear All 10 In a previous year, 58% of females aged 15 and older lived alone. A sociologist tests whether this percentage is different today by conducting a random sample of 650 females aged 15 and older and finds that 382 are living alone. Is there sufficient evidence at the a = 0.05 level of significance to conclude the proportion has changed Because npo (1 - Po ) = 158.3 > 10, the sample size is less than 5% of the population size, and the sample is a random sample, all of the requirements for testing the hypothesis are satisfied. Round to one decimal place as needed.) Identify the null and alternative hypotheses for this test. Ho: H = 0.5877 versus Hy: M = 0.5877 (Type integers or decimals. Do not round.) Help Me Solve This View an Example Get More Help - Clear All Final Check
Step by Step Solution
There are 3 Steps involved in it

Get step-by-step solutions from verified subject matter experts