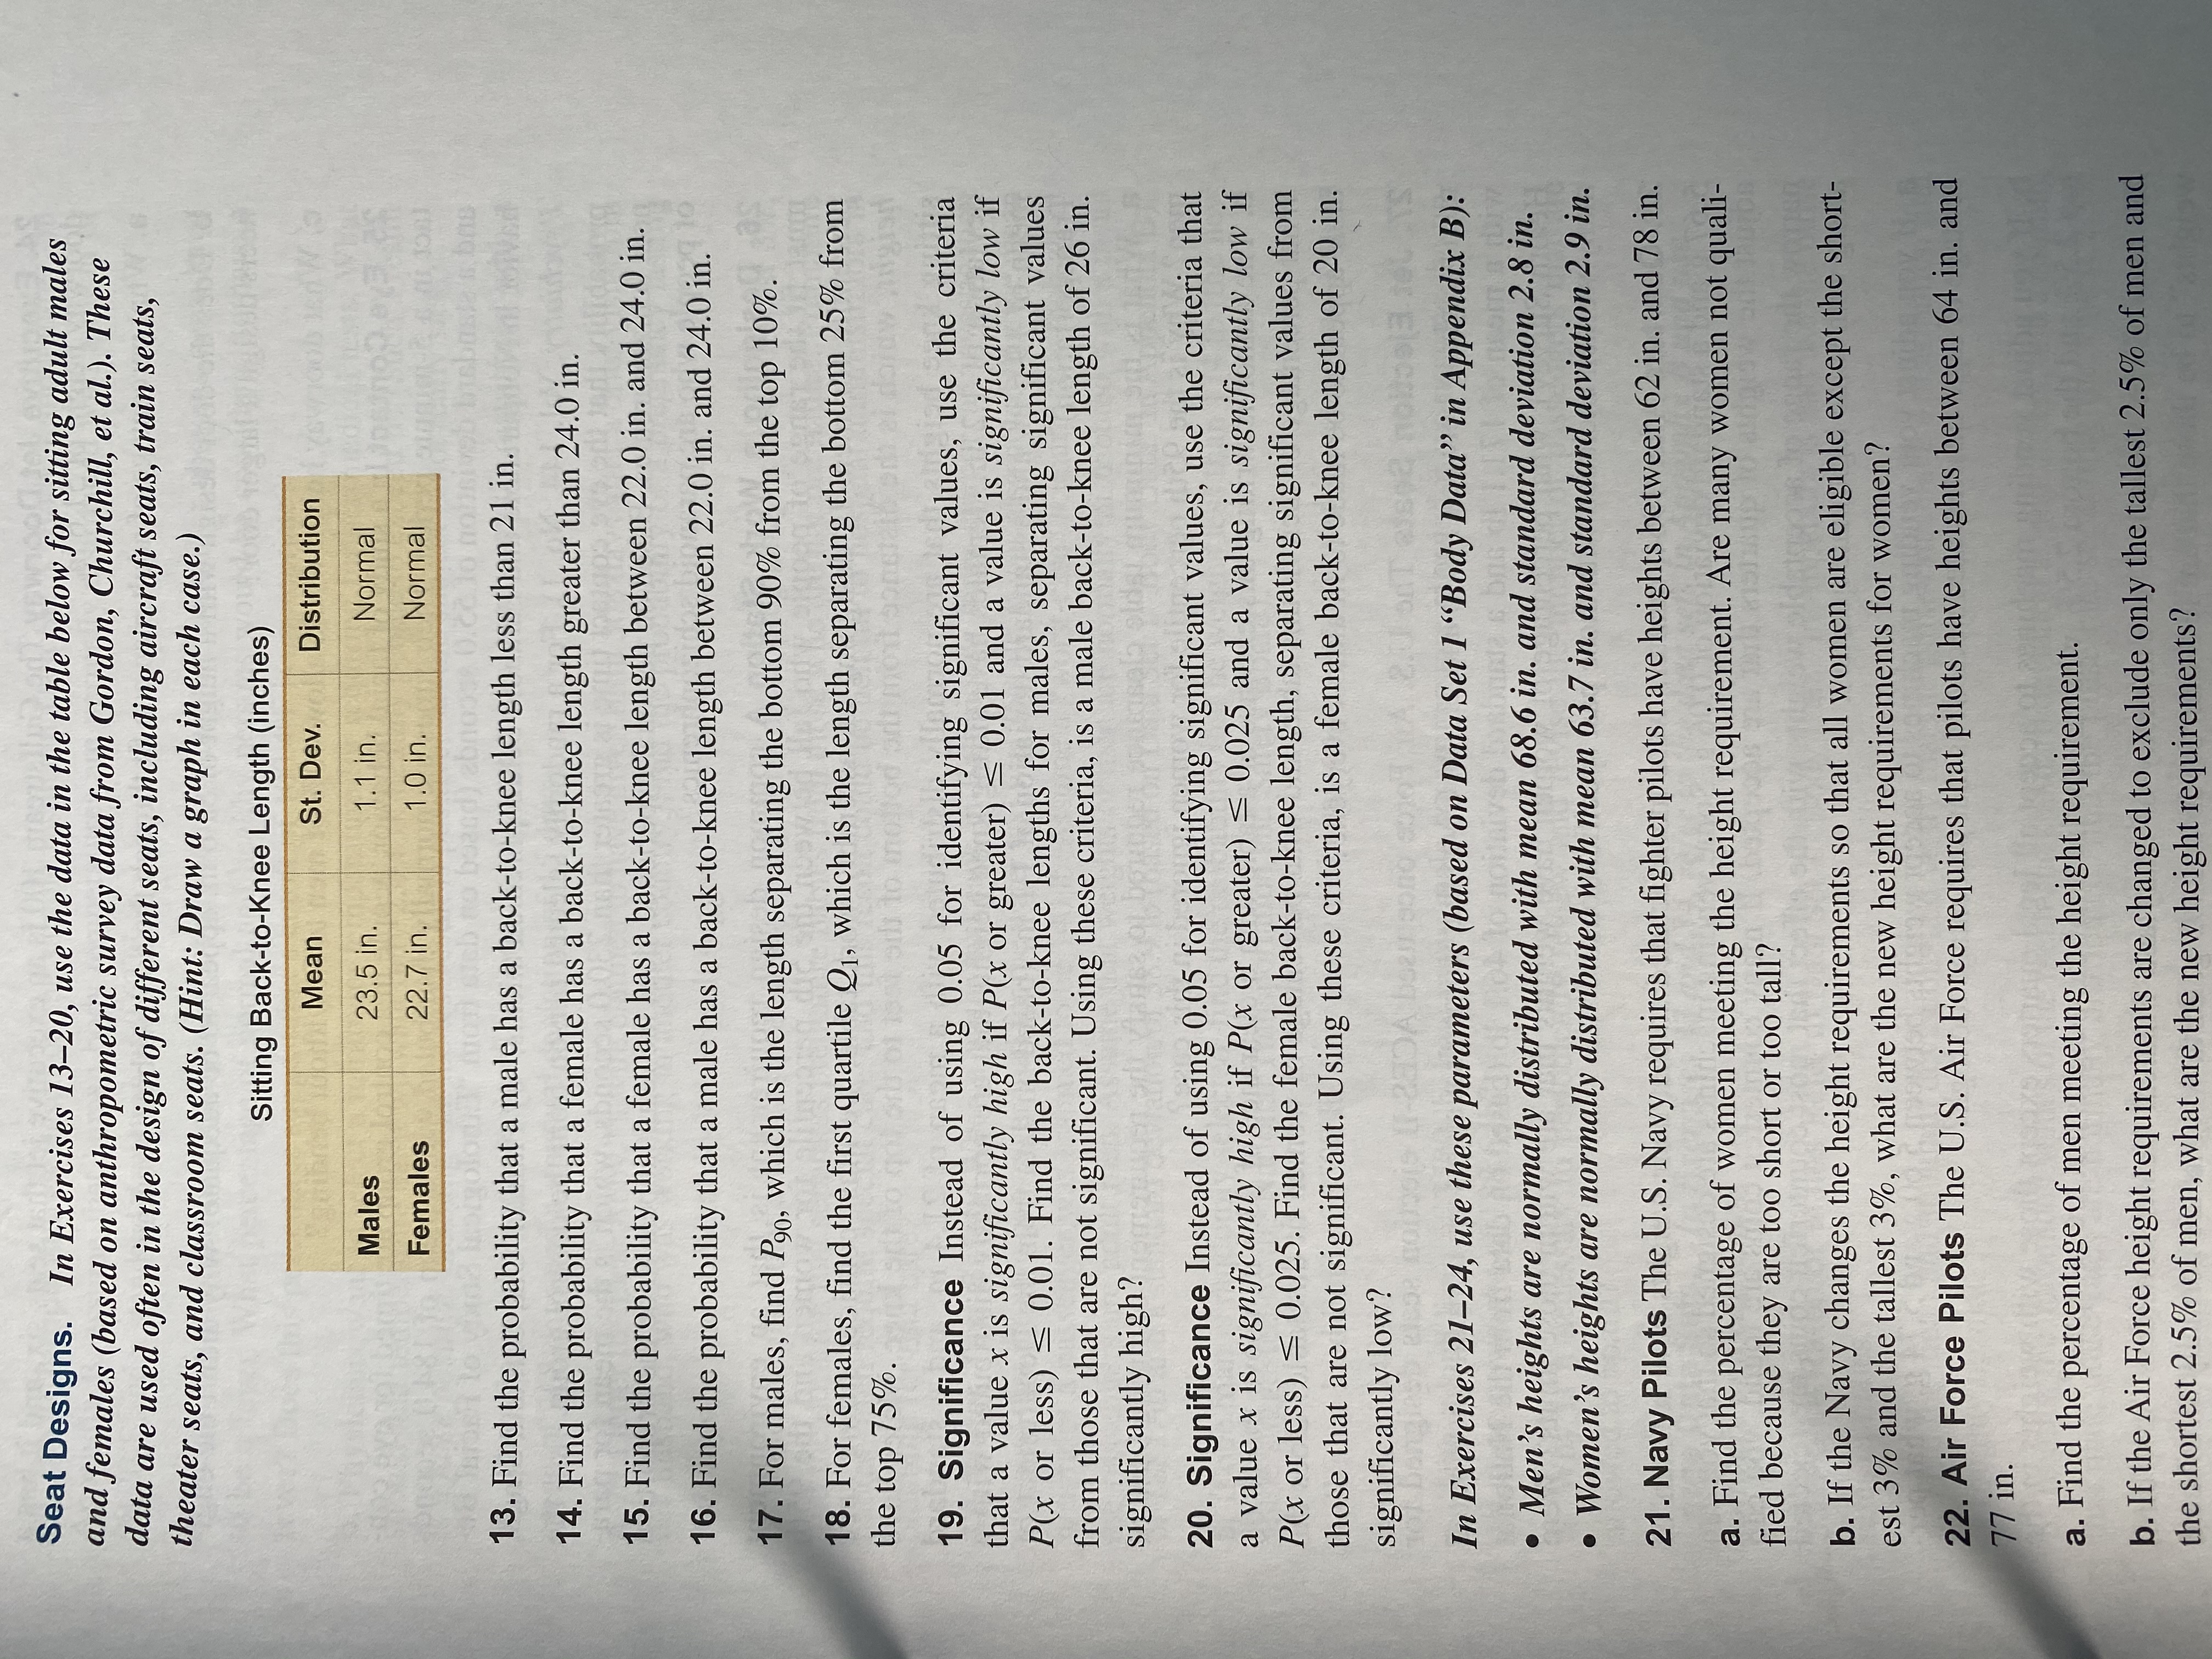
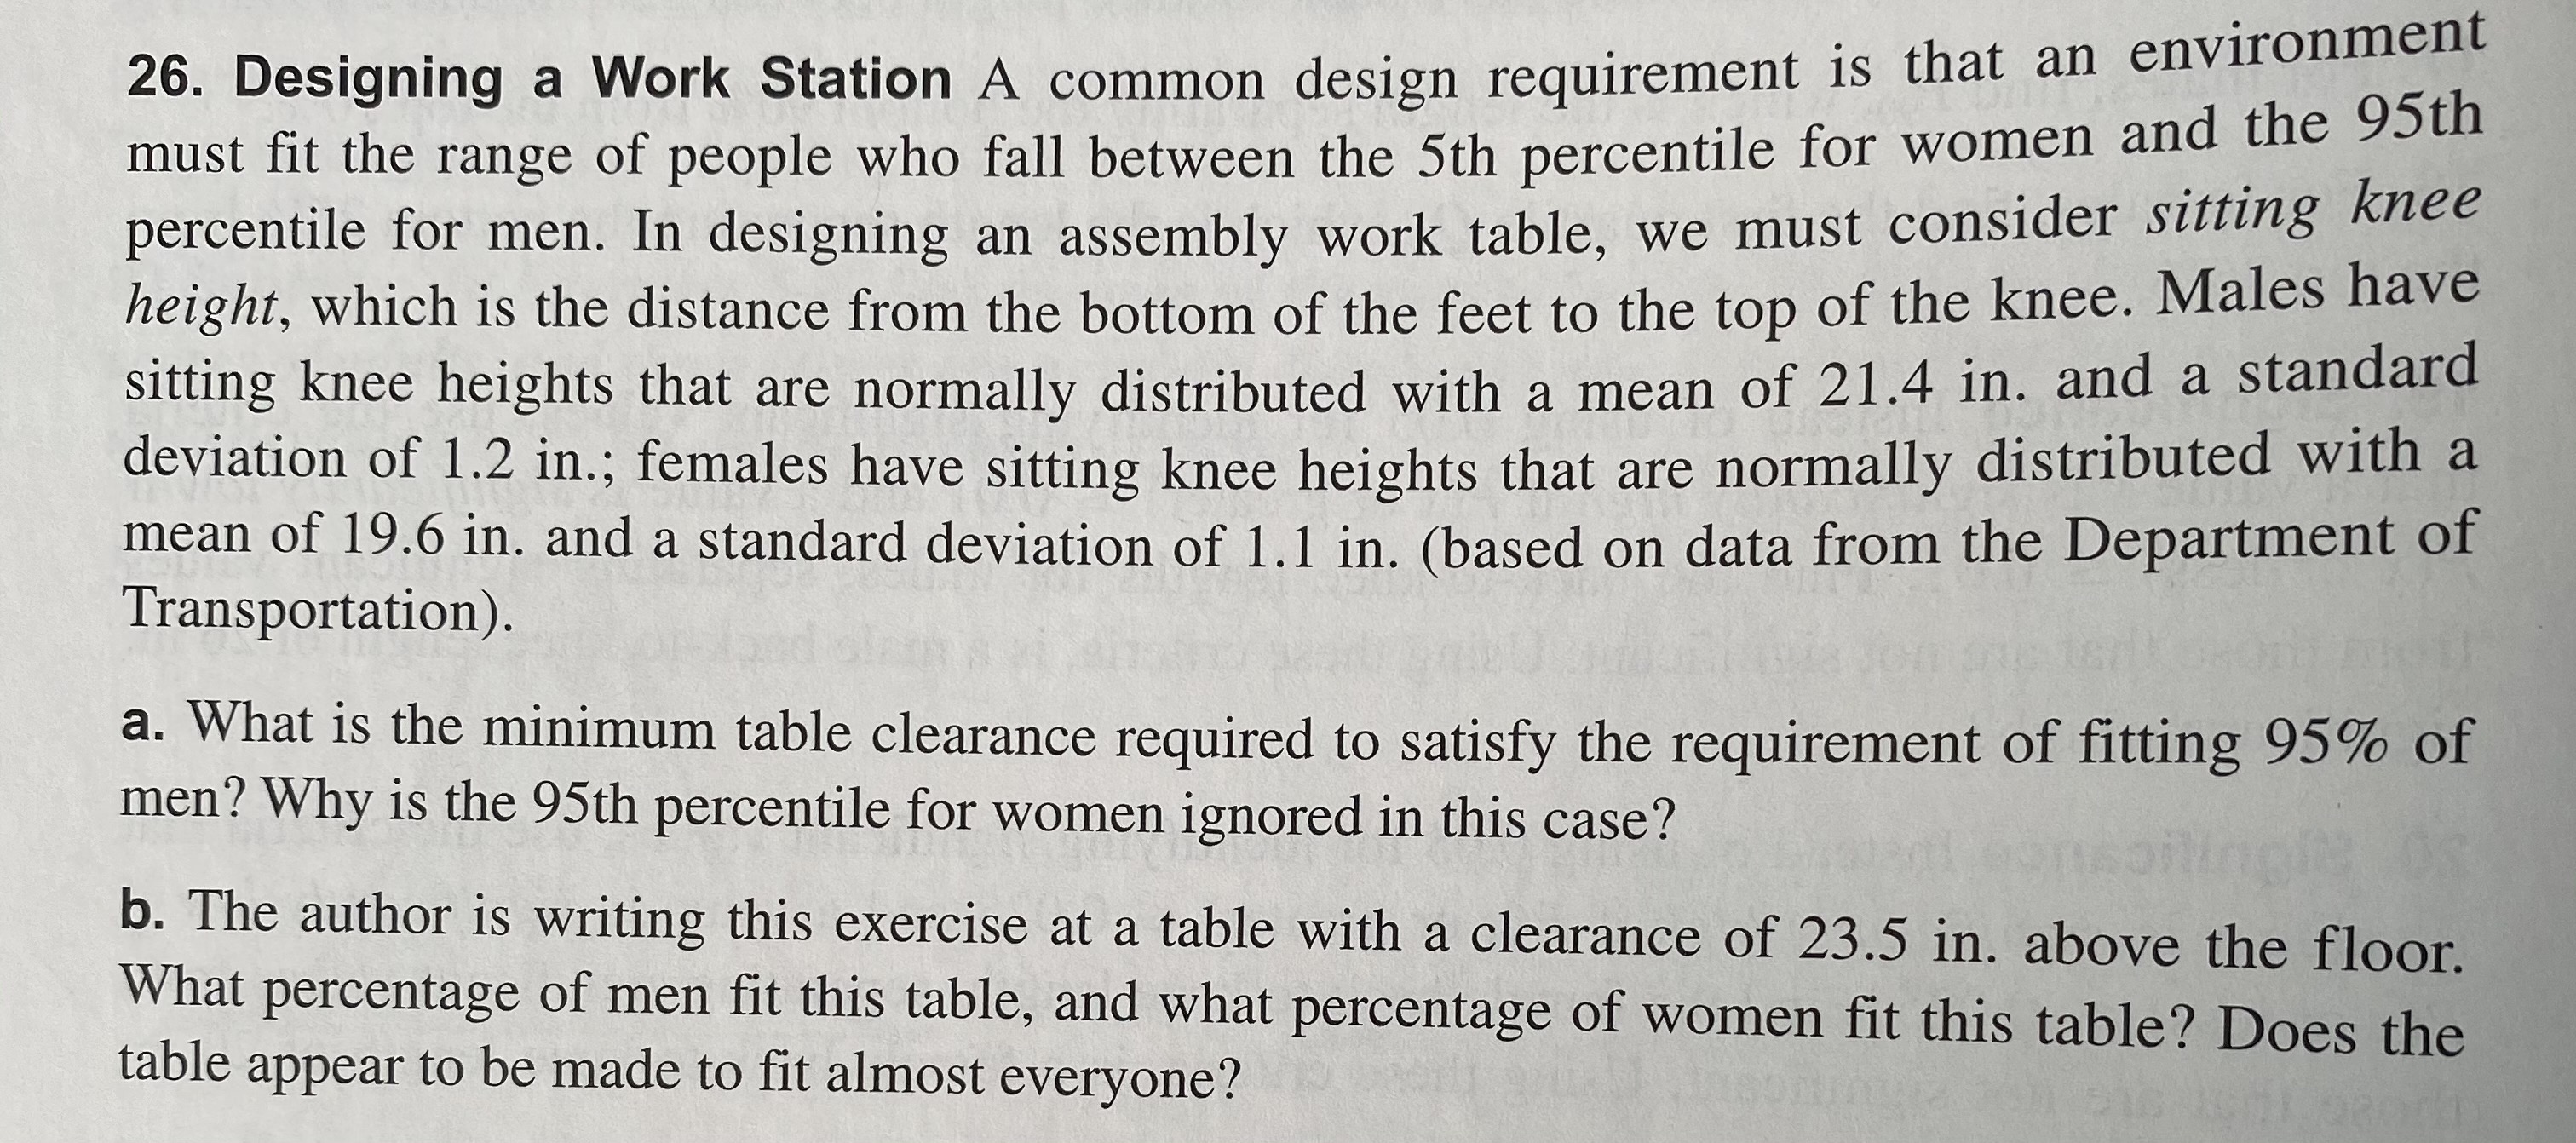
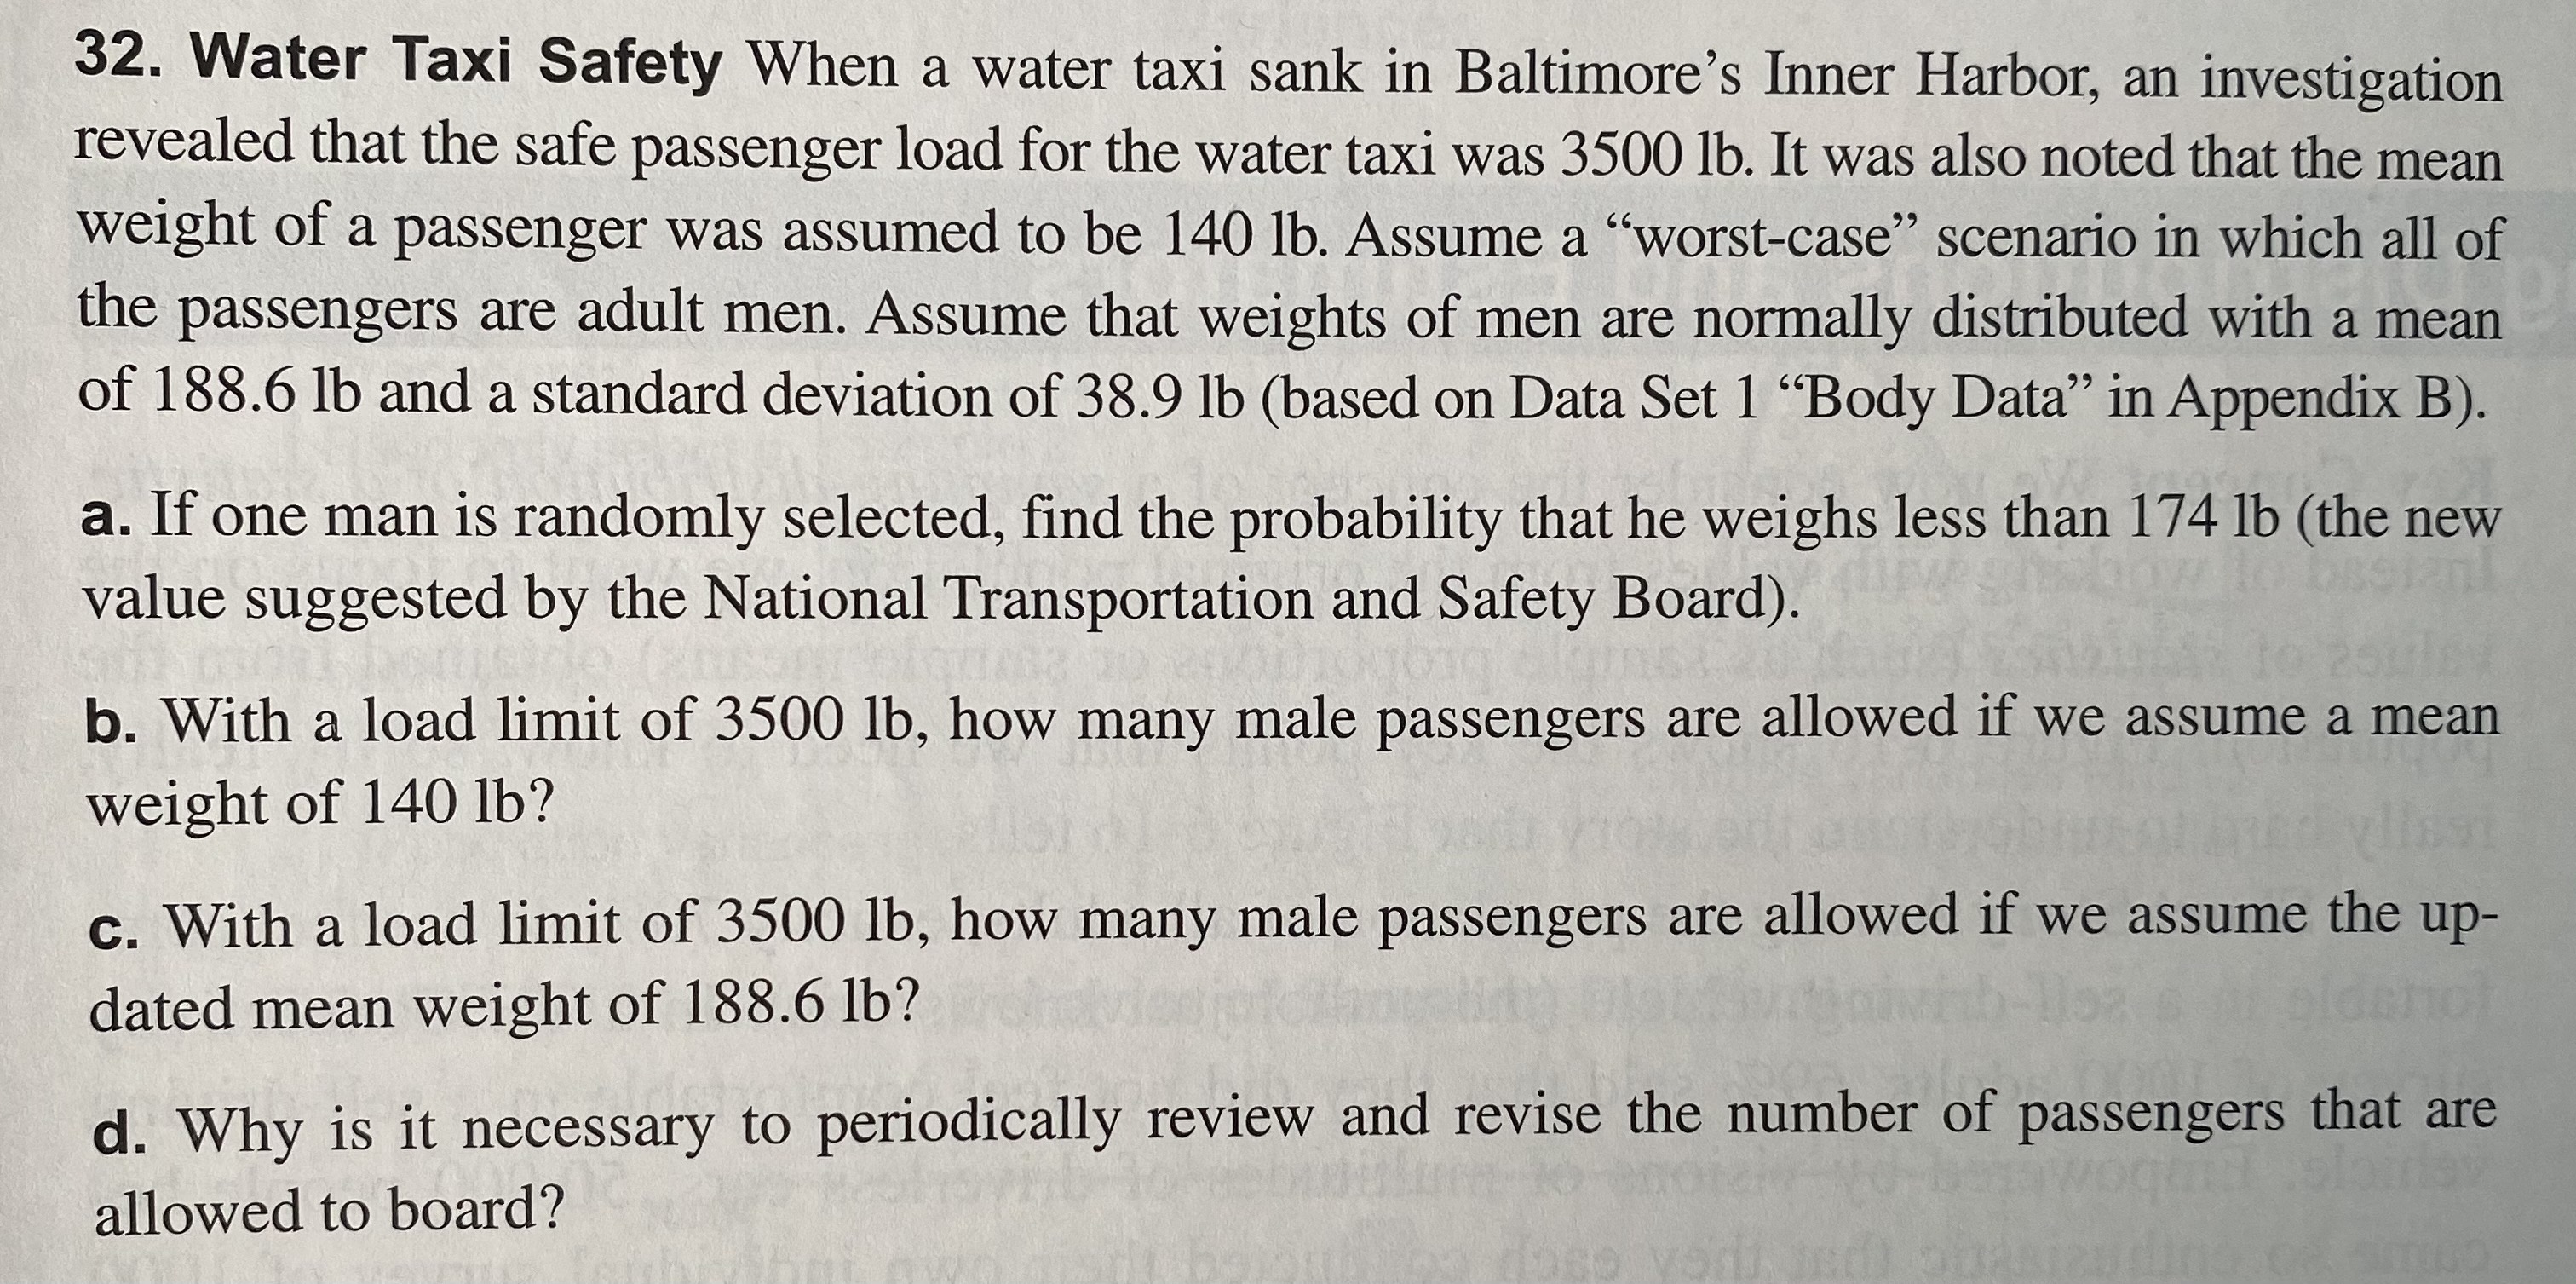
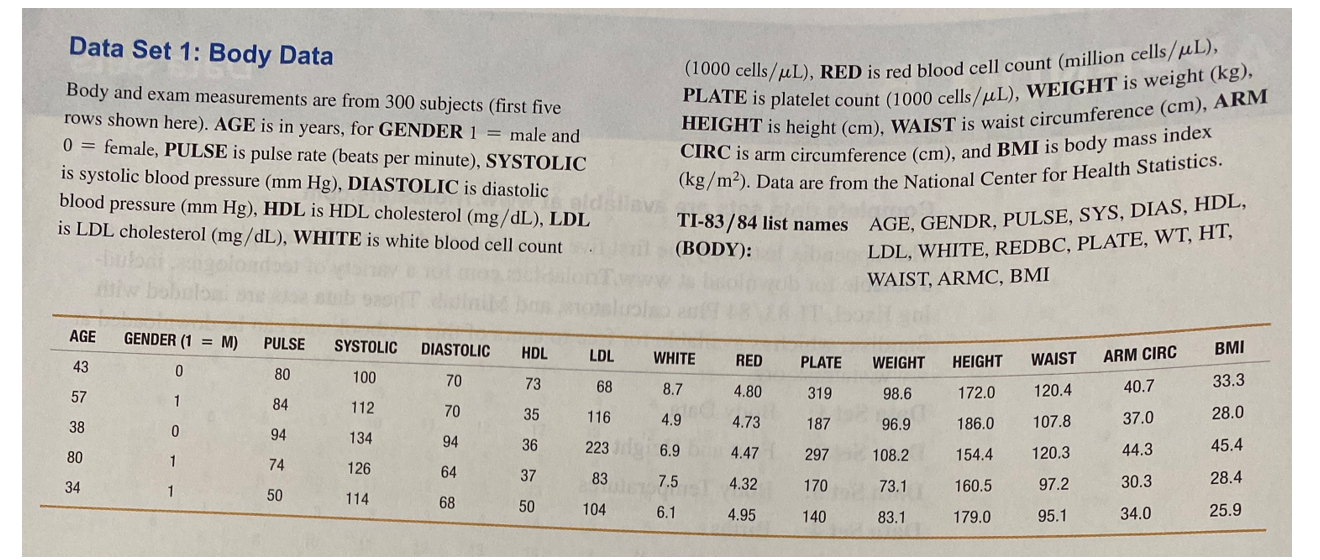
Seat Designs. In Exercises 13-20, use the data in the table below for sitting adult males and females (based on anthropometric survey data from Gordon, Churchill, et al.). These data are used often in the design of different seats, including aircraft seats, train seats, theater seats, and classroom seats. (Hint: Draw a graph in each case.) Sitting Back-to-Knee Length (inches) Mean St. Dev. Distribution Males 23.5 in. 1.1 in. Norma Females 22.7 in. 1.0 in. Normal 13. Find the probability that a male has a back-to-knee length less than 21 in. 14. Find the probability that a female has a back-to-knee length greater than 24.0 in. 15. Find the probability that a female has a back-to-knee length between 22.0 in. and 24.0 in. 16. Find the probability that a male has a back-to-knee length between 22.0 in. and 24.0 in. 17. For males, find Poo, which is the length separating the bottom 90% from the top 10%. 18. For females, find the first quartile 21, which is the length separating the bottom 25% from the top 75%. 19. Significance Instead of using 0.05 for identifying significant values, use the criteria that a value x is significantly high if P(x or greater) - 0.01 and a value is significantly low if P(x or less) - 0.01. Find the back-to-knee lengths for males, separating significant values from those that are not significant. Using these criteria, is a male back-to-knee length of 26 in. significantly high? 20. Significance Instead of using 0.05 for identifying significant values, use the criteria that a value x is significantly high if P(x or greater) = 0.025 and a value is significantly low if P(x or less) = 0.025. Find the female back-to-knee length, separating significant values from those that are not significant. Using these criteria, is a female back-to-knee length of 20 in. significantly low? In Exercises 21-24, use these parameters (based on Data Set 1 "Body Data" in Appendix B): . Men's heights are normally distributed with mean 68.6 in. and standard deviation 2.8 in. . Women's heights are normally distributed with mean 63.7 in. and standard deviation 2.9 in. 21. Navy Pilots The U.S. Navy requires that fighter pilots have heights between 62 in. and 78 in. a. Find the percentage of women meeting the height requirement. Are many women not quali- fied because they are too short or too tall? b. If the Navy changes the height requirements so that all women are eligible except the short- est 3% and the tallest 3%, what are the new height requirements for women? 22. Air Force Pilots The U.S. Air Force requires that pilots have heights between 64 in. and 77 in. a. Find the percentage of men meeting the height requirement. b. If the Air Force height requirements are changed to exclude only the tallest 2.5% of men and the shortest 2.5% of men, what are the new height requirements?26. Designing a Work Station A common design requirement is that an environment must fit the range of people who fall between the 5th percentile for women and the 95th percentile for men. In designing an assembly work table, we must consider sitting knee height, which is the distance from the bottom of the feet to the top of the knee. Males have sitting knee heights that are normally distributed with a mean of 21.4 in. and a standard deviation of 1.2 in.; females have sitting knee heights that are normally distributed with a mean of 19.6 in. and a standard deviation of 1.1 in. (based on data from the Department of Transportation). a. What is the minimum table clearance required to satisfy the requirement of fitting 95% of men? Why is the 95th percentile for women ignored in this case? b. The author is writing this exercise at a table with a clearance of 23.5 in. above the floor. What percentage of men fit this table, and what percentage of women fit this table? Does the table appear to be made to fit almost everyone?32. Water Taxi Safety When a water taxi sank in Baltimore's Inner Harbor, an investigation revealed that the safe passenger load for the water taxi was 3500 1b. It was also noted that the mean weight of a passenger was assumed to be 140 1b. Assume a "worst-case" scenario in which all of the passengers are adult men. Assume that weights of men are normally distributed with a mean of 188.6 1b and a standard deviation of 38.9 1b (based on Data Set 1 "Body Data" in Appendix B). a. If one man is randomly selected, find the probability that he weighs less than 174 1b (the new value suggested by the National Transportation and Safety Board). b. With a load limit of 3500 1b, how many male passengers are allowed if we assume a mean weight of 140 1b? c. With a load limit of 3500 1b, how many male passengers are allowed if we assume the up- dated mean weight of 188.6 1b? d. Why is it necessary to periodically review and revise the number of passengers that are allowed to board?Data Set 1: Body Data (1000 cells/ ML), RED is red blood cell count (million cells/ ML), Body and exam measurements are from 300 subjects (first five PLATE is platelet count (1000 cells/ML), WEIGHT is weight (kg), rows shown here). AGE is in years, for GENDER 1 = male and HEIGHT is height (cm), WAIST is waist circumference (cm), ARM 0 = female, PULSE is pulse rate (beats per minute), SYSTOLIC CIRC is arm circumference (cm), and BMI is body mass index is systolic blood pressure (mm Hg), DIASTOLIC is diastolic (kg/m2). Data are from the National Center for Health Statistics. blood pressure (mm Hg), HDL is HDL cholesterol (mg/dL), LDL dellavs is LDL cholesterol (mg/dL), WHITE is white blood cell count TI-83 /84 list names AGE, GENDR, PULSE, SYS, DIAS, HDL, (BODY): LDL, WHITE, REDBC, PLATE, WT, HT, WAIST, ARMC, BMI AGE GENDER (1 = M) PULSE SYSTOLIC DIASTOLIC 43 HDL LDL 80 WHITE RED 100 PLATE WEIGHT HEIGHT WAIST ARM CIRC BMI 57 70 73 68 84 8.7 112 4.80 70 319 98.6 172.0 120.4 40.7 33.3 38 O 35 116 28.0 94 4.9 134 4.73 187 96.9 186.0 107.8 37.0 94 80 36 74 223 6.9 126 4.47 297 108.2 154.4 120.3 44.3 45.4 34 64 37 50 83 7.5 114 4.32 68 170 73.1 160.5 97.2 30.3 28.4 50 104 6.1 4.95 140 83.1 179.0 95.1 34.0 25.9


