second question. please availability to help me
https:/exfordu-my.sharepoint.com/:w:/g/personal/gsyah_learner_nexford_org/EXEm-mg0oxdJpTLZ7wxr-ewBkx0KtjFQB4sQ3yMSgnI2eA
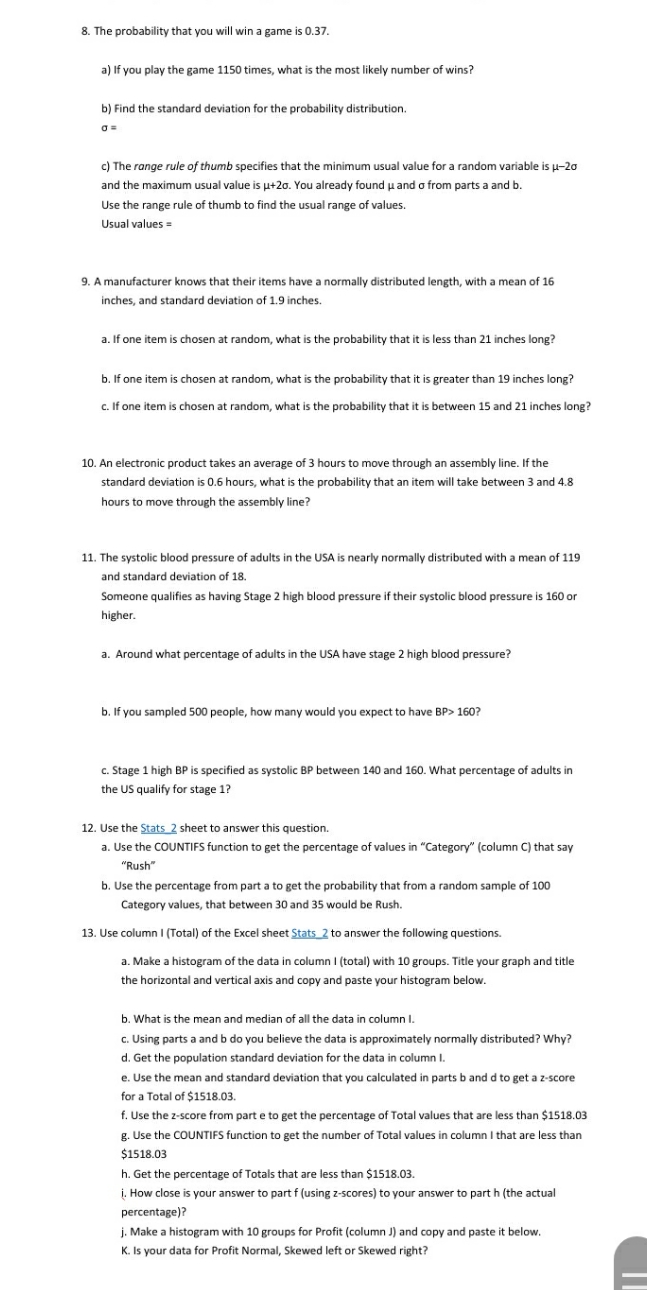
8. The probability that you will win a game is 0.37. a) If you play the game 1150 times, what is the most likely number of wins? b) Find the standard deviation for the probability distribution. a = c) The range rule of thumb specifies that the minimum usual value for a random variable is u-20 and the maximum usual value is u+20. You already found u and o from parts a and b. Use the range rule of thumb to find the usual range of values. Usual values = 9. A manufacturer knows that their items have a normally distributed length, with a mean of 16 inches, and standard deviation of 1.9 inches. a. If one item is chosen at random, what is the probability that it is less than 21 inches long? b. If one item is chosen at random, what is the probability that it is greater than 19 inches long? c. If one item is chosen at random, what is the probability that it is between 15 and 21 inches long? 10. An electronic product takes an average of 3 hours to move through an assembly line. If the standard deviation is 0.6 hours, what is the probability that an item will take between 3 and 4.8 hours to move through the assembly line? 11. The systolic blood pressure of adults in the USA is nearly normally distributed with a mean of 119 and standard deviation of 18. Someone qualifies as having Stage 2 high blood pressure if their systolic blood pressure is 160 or higher. a. Around what percentage of adults in the USA have stage 2 high blood pressure? b. If you sampled 500 people, how many would you expect to have BP> 160? c. Stage 1 high BP is specified as systolic BP between 140 and 160. What percentage of adults in the US qualify for stage 1? 12. Use the Stats 2 sheet to answer this question. a. Use the COUNTIFS function to get the percentage of values in "Category" (column C) that say "Rush" b. Use the percentage from part a to get the probability that from a random sample of 100 Category values, that between 30 and 35 would be Rush. 13. Use column I (Total) of the Excel sheet Stats_2 to answer the following questions. a. Make a histogram of the data in column I (total) with 10 groups. Title your graph and title the horizontal and vertical axis and copy and paste your histogram below. b. What is the mean and median of all the data in column I. C. Using parts a and b do you believe the data is approximately normally distributed? Why? d. Get the population standard deviation for the data in column I. e. Use the mean and standard deviation that you calculated in parts b and d to get a z-score for a Total of $1518.03. f. Use the z-score from part e to get the percentage of Total values that are less than $1518.03 g. Use the COUNTIES function to get the number of Total values in column I that are less than $1518.03 h. Get the percentage of Totals that are less than $1518.03. i. How close is your answer to part f (using z-scores) to your answer to part h (the actual percentage)? j. Make a histogram with 10 groups for Profit (column J) and copy and paste it below. K. Is your data for Profit Normal, Skewed left or Skewed right