

Answered step by step
Verified Expert Solution
Question
1 Approved Answer
Section 1 : Preliminaries 1 a ) Simulating a Multinomial np . random. multinomial ( n , p _ array ) simulates n draws at
Section : Preliminaries
a Simulating a Multinomial
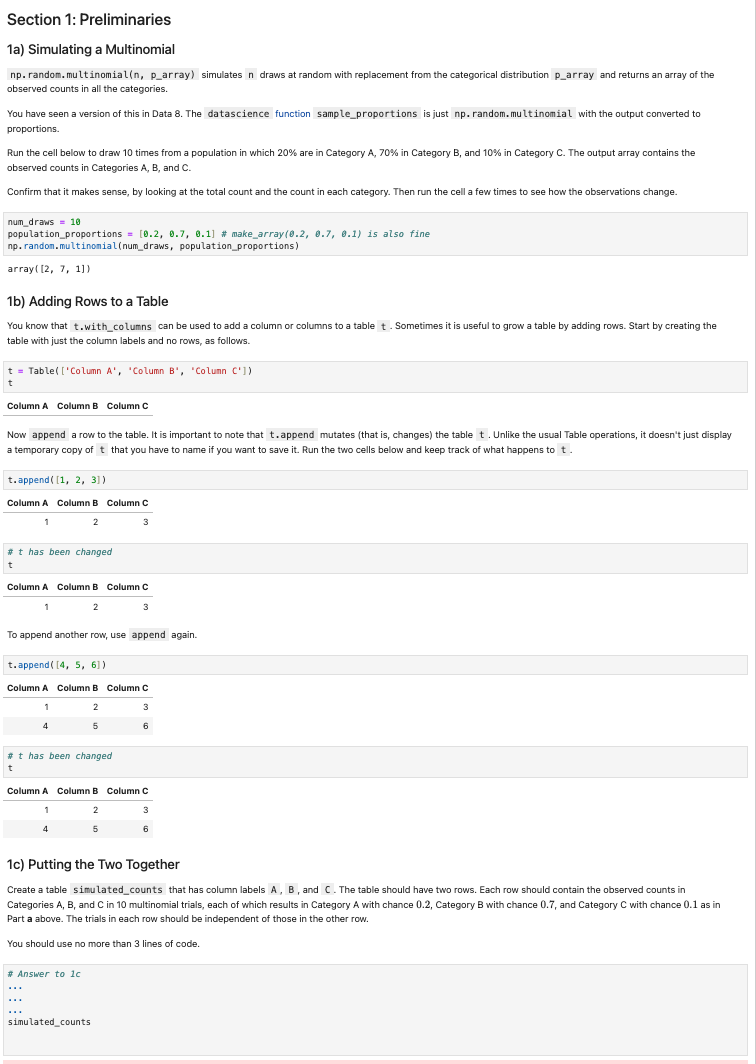
np random. multinomial parray simulates draws at random with replacement from the categorical distribution parray and returns an array of the
observed counts in all the categories.
You have seen a version of this in Data The datascience function sampleproportions is just np random. multinomial with the output converted to
proportions.
Run the cell below to draw times from a population in which are in Category A in Category B and in Category C The output array contains the
observed counts in Categories A B and C
Confirm that it makes sense, by looking at the total count and the count in each category. Then run the cell a few times to see how the observations change.
numdraws
populationproportions # makearray is also fine
np randon.multinonialnumdraws, populationproportions
array
b Adding Rows to a Table
You know that withcolumns can be used to add a column or columns to a table Sometimes it is useful to grow a table by adding rows. Start by creating the
table with just the column labels and no rows, as follows.
Table Column 'Column 'Colunn
Column A Column B Column C
a temporary copy of that you have to name if you want to save it Run the two cells below and keep track of what happens to
tappend
has been changed
Column A Column B Column C
To append another row, use append again.
tappend
c Putting the Two Together
Create a table simulatedcounts that has column labels A B and C The table should have two rows. Each row should contain the observed counts in
Categories A B and C in multinomial trials, each of which results in Category A with chance Category B with chance and Category C with chance as in
Part a above. The trials in each row should be independent of those in the other row.
You should use no more than lines of code.
Answer to
a
simulatedcounts. Please help solve the last part
Step by Step Solution
There are 3 Steps involved in it
Step: 1

Get Instant Access to Expert-Tailored Solutions
See step-by-step solutions with expert insights and AI powered tools for academic success
Step: 2

Step: 3
Ace Your Homework with AI
Get the answers you need in no time with our AI-driven, step-by-step assistance
Get Started
Main Memory Database Systems
Authors: Frans Faerber, Alfons Kemper, Per-Åke Alfons
1st Edition
1680833243, 978-1680833249