

Answered step by step
Verified Expert Solution
Question
1 Approved Answer
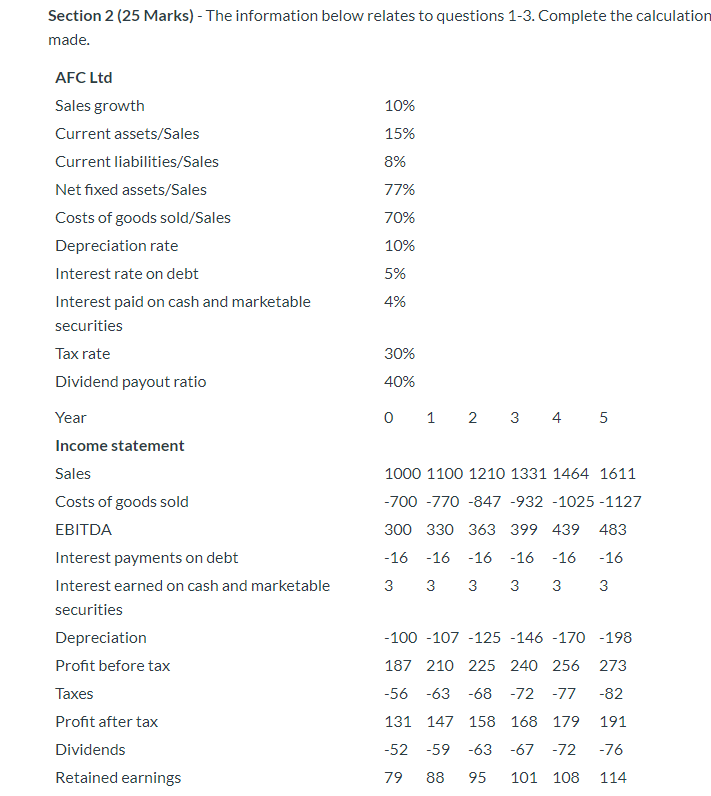
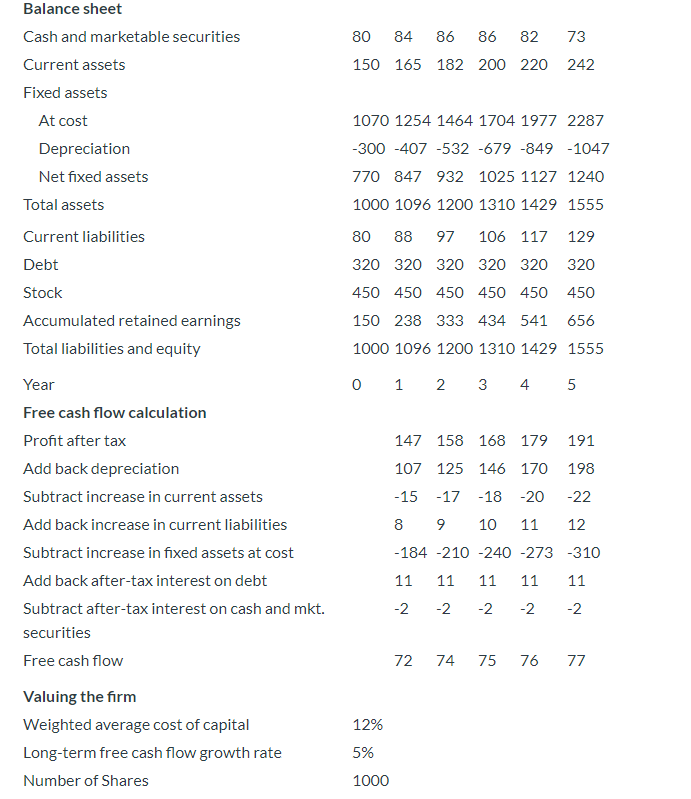
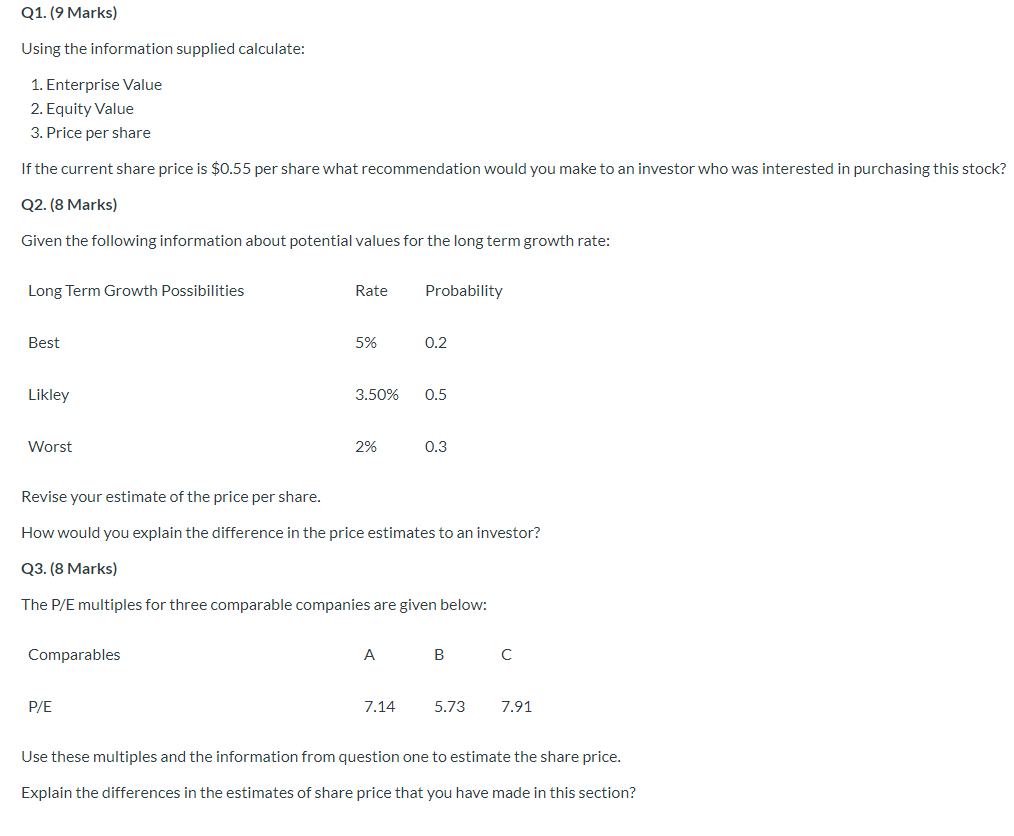
Section 2 (25 Marks) - The information below relates to questions 1-3. Complete the calculation made. 10% 15% 8% 77% AFC Ltd Sales growth Current
Step by Step Solution
There are 3 Steps involved in it
Step: 1

Get Instant Access to Expert-Tailored Solutions
See step-by-step solutions with expert insights and AI powered tools for academic success
Step: 2

Step: 3
Ace Your Homework with AI
Get the answers you need in no time with our AI-driven, step-by-step assistance
Get Started
How To Avoid IRS Audits
Authors: Victor S. Sy, CPA, MBA, Allana Santos, Roger Oriel, Louie Gajardo, Malou Aguilar Bledsoe, RJ Oriel, Mark Xavier Bautista, Kenno Samulde, Morton D Rosenthal Esq.
1st Edition
1530746477, 978-1530746477