Answered step by step
Verified Expert Solution
Question
1 Approved Answer
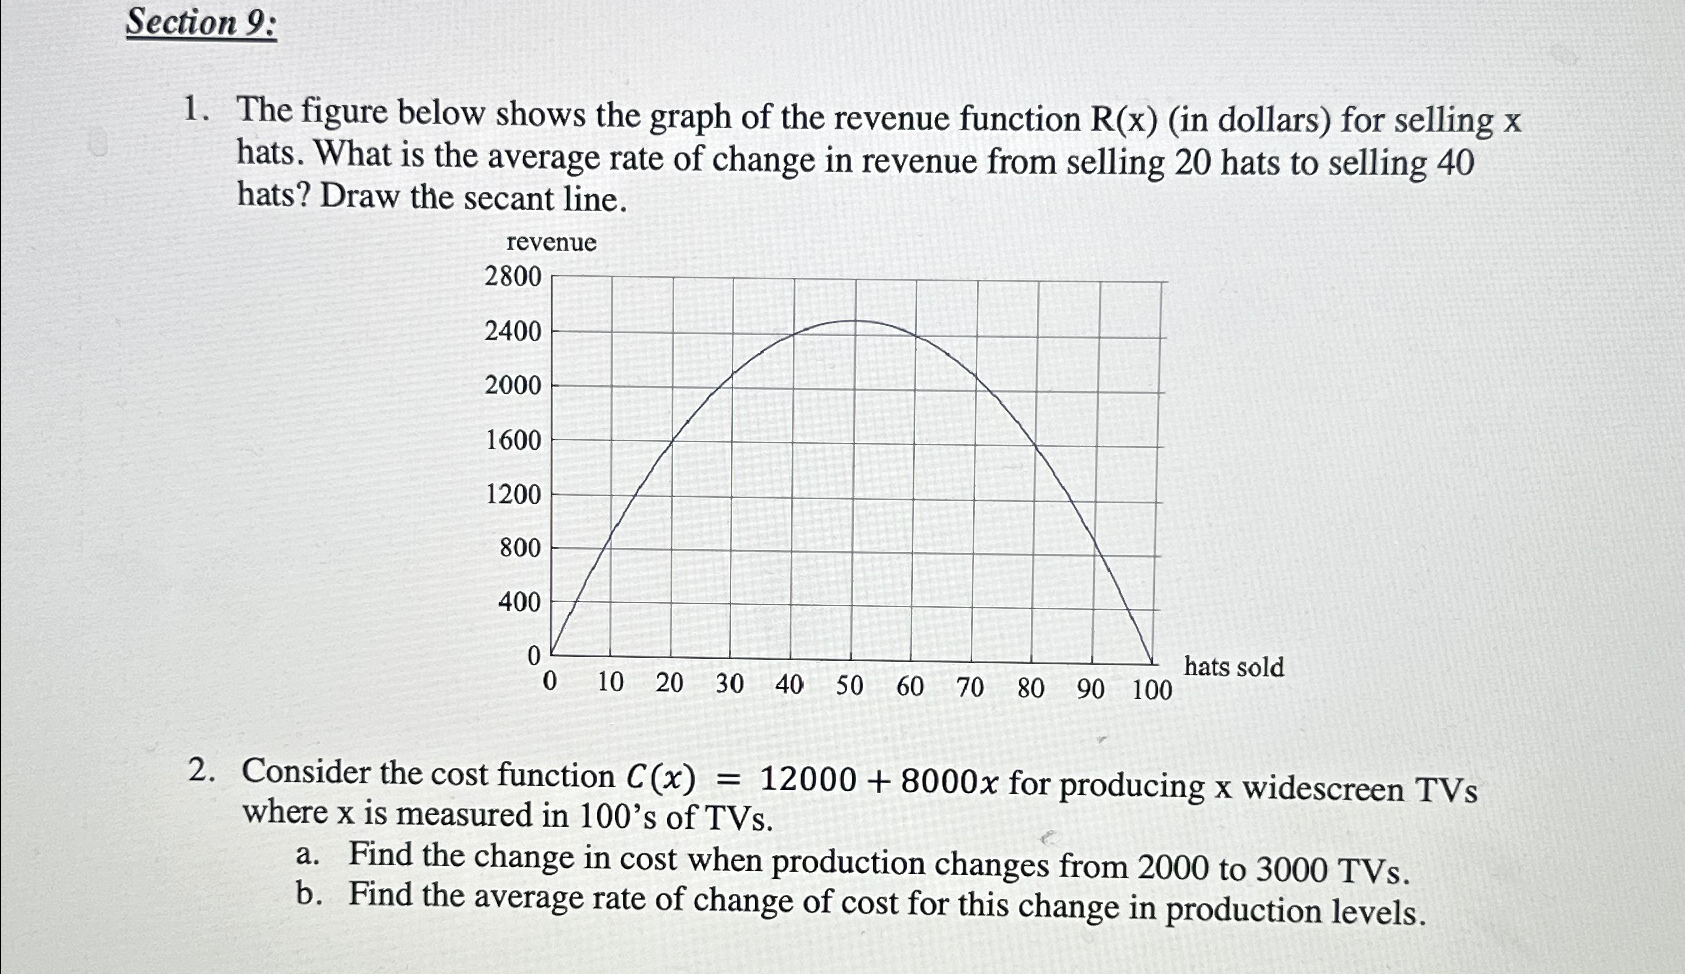
Section 9 : The figure below shows the graph of the revenue function R ( x ) ( in dollars ) for selling x hats.
Section :
The figure below shows the graph of the revenue function in dollars for selling hats. What is the average rate of change in revenue from selling hats to selling hats? Draw the secant line.
revenue
Consider the cost function for producing widescreen TVs where is measured in s of TVs
a Find the change in cost when production changes from to TVs
b Find the average rate of change of cost for this change in production levels.

Step by Step Solution
There are 3 Steps involved in it
Step: 1

Get Instant Access to Expert-Tailored Solutions
See step-by-step solutions with expert insights and AI powered tools for academic success
Step: 2

Step: 3

Ace Your Homework with AI
Get the answers you need in no time with our AI-driven, step-by-step assistance
Get Started


