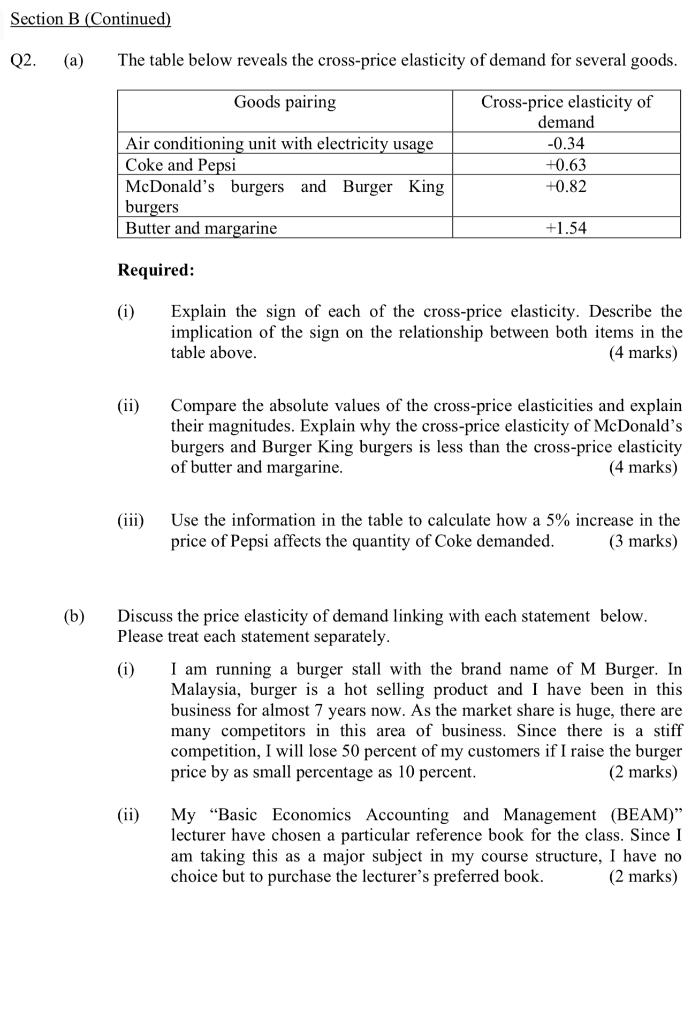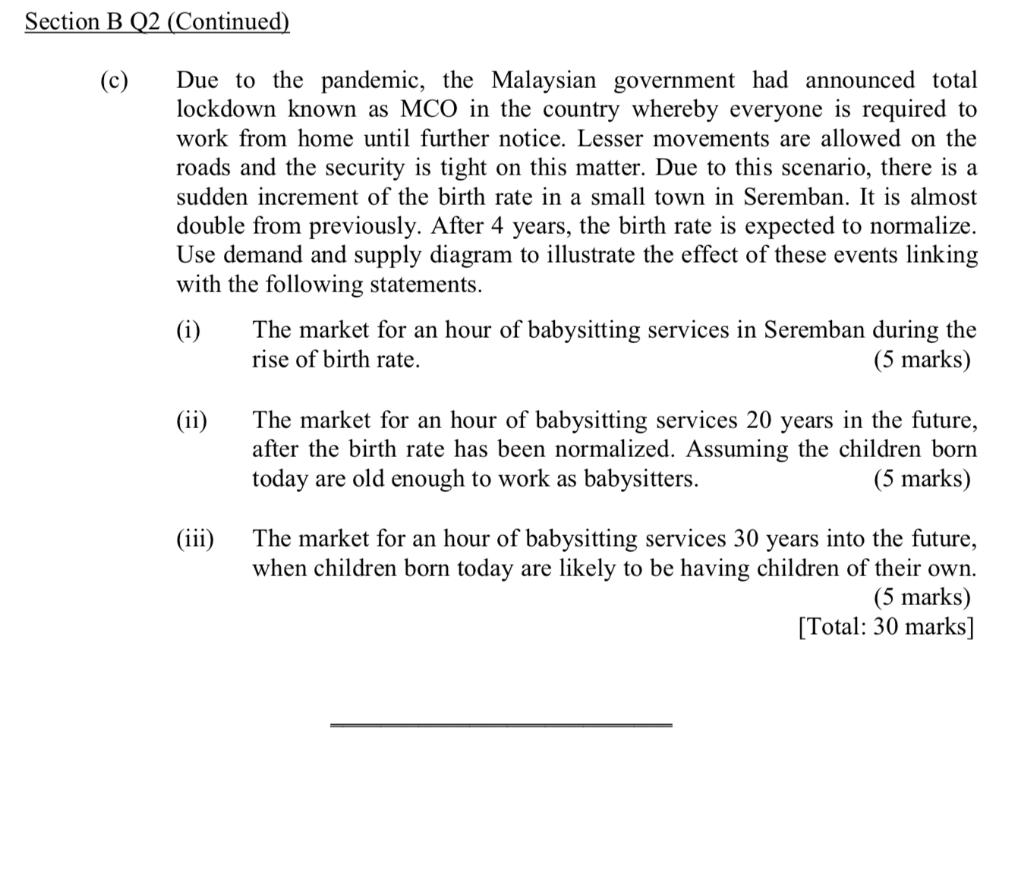

Section B (Continued) Q2. (a) The table below reveals the cross-price elasticity of demand for several goods. Goods pairing Air conditioning unit with electricity usage Coke and Pepsi McDonald's burgers and Burger King burgers Butter and margarine Cross-price elasticity of demand -0.34 +0.63 +0.82 +1.54 Required: (i) Explain the sign of each of the cross-price elasticity. Describe the implication of the sign on the relationship between both items in the table above. (4 marks) (ii) Compare the absolute values of the cross-price elasticities and explain their magnitudes. Explain why the cross-price elasticity of McDonald's burgers and Burger King burgers is less than the cross-price elasticity of butter and margarine. (4 marks) (iii) Use the information in the table to calculate how a 5% increase in the price of Pepsi affects the quantity of Coke demanded. (3 marks) (6) Discuss the price elasticity of demand linking with each statement below. Please treat each statement separately. (i) I am running a burger stall with the brand name of M Burger. In Malaysia, burger is a hot selling product and I have been in this business for almost 7 years now. As the market share is huge, there are many competitors in this area of business. Since there is a stiff competition, I will lose 50 percent of my customers if I raise the burger price by as small percentage as 10 percent. (2 marks) My "Basic Economics Accounting and Management (BEAM)" lecturer have chosen a particular reference book for the class. Since I am taking this as a major subject in my course structure, I have no choice but to purchase the lecturer's preferred book. (2 marks) Section B Q2 (Continued) (c) Due to the pandemic, the Malaysian government had announced total lockdown known as MCO in the country whereby everyone is required to work from home until further notice. Lesser movements are allowed on the roads and the security is tight on this matter. Due to this scenario, there is a sudden increment of the birth rate in a small town in Seremban. It is almost double from previously. After 4 years, the birth rate is expected to normalize. Use demand and supply diagram to illustrate the effect of these events linking with the following statements. (i) The market for an hour of babysitting services in Seremban during the rise of birth rate. (5 marks) (ii) The market for an hour of babysitting services 20 years in the future, after the birth rate has been normalized. Assuming the children born today are old enough to work as babysitters. (5 marks) (iii) The market for an hour of babysitting services 30 years into the future, when children born today are likely to be having children of their own. (5 marks) [Total: 30 marks]


