

Answered step by step
Verified Expert Solution
Question
1 Approved Answer
Security A Time Price Dividend 1 $ 8.50 Price Security B $ 35.00 Dividend Price $ 8.80 $ 0.45 $37.00 $ 3 $ 9.25
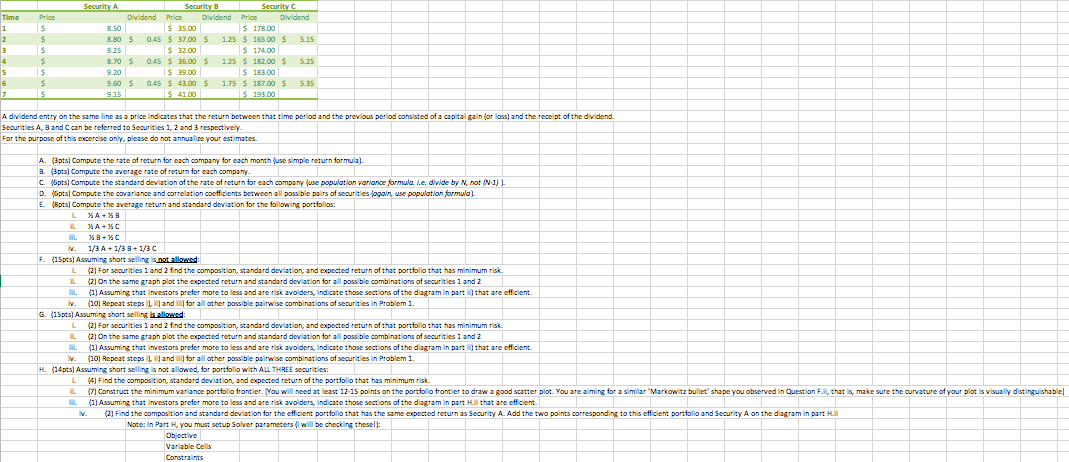
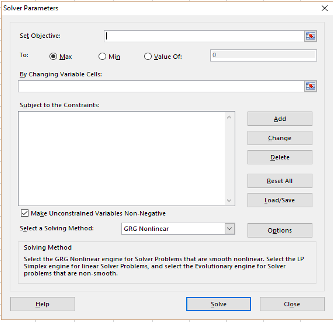
Security A Time Price Dividend 1 $ 8.50 Price Security B $ 35.00 Dividend Price $ 8.80 $ 0.45 $37.00 $ 3 $ 9.25 $ 32.00 Security C $ 178.00 1.25 $165.00 $ 5.15 $174.00 Dividend 4 $ 6 8.70 $ 9.20 9.60 $ 9.15 0.45 $36.00 $ $ 39.00 0.45 $ 43.00 $ $ 41.00 1.25 $ 182.00 $ 5.25 $183.00 1.75 $ 187.00 $ $193.00 5.35 A dividend entry on the same line as a price indicates that the return between that time period and the previous period consisted of a capital gain (or loss) and the receipt of the dividend. Securities A, B and C can be referred to Securities 1, 2 and 3 respectively. For the purpose of this excercise only, please do not annualize your estimates. A. (3pts) Compute the rate of return for each company for each month (use simple return formula). 8. (3pts) Compute the average rate of return for each company. C. (6pts) Compute the standard deviation of the rate of return for each company (use population variance formula. I.e. divide by N, not (N-1)). D. (6pts) Compute the covariance and correlation coefficients between all possible pairs of securities (again, use population formula). E. (8pts) Compute the average return and standard deviation for the following portfolios: L XA+%B IL XA+%C M XB+%C iv. 1/3 A+ 1/3 B+ 1/3 C F. (15pts) Assuming short selling is not allowed: (2) For securities 1 and 2 find the composition, standard deviation, and expected return of that portfolio that has minimum risk. L IL (2) On the same graph plot the expected return and standard deviation for all possible combinations of securities 1 and 2 L iv. (1) Assuming that investors prefer more to less and are risk avolders, indicate those sections of the diagram in part ) that are efficient. (10) Repeat steps),) and for all other possible pairwise combinations of securities in Problem 1. G. (15pts) Assuming short selling is allowed: (2) On the same graph plot the expected return and standard deviation for all possible combinations of securities 1 and 2 L (2) For securities 1 and 2 find the composition, standard deviation, and expected return of that portfolio that has minimum risk. IL W (1) Assuming that investors prefer more to less and are risk avolders, indicate those sections of the diagram in part ii) that are efficient. iv. (10) Repeat steps),) and for all other possible pairwise combinations of securities in Problem 1. L (4) Find the composition, standard deviation, and expected return of the portfolio that has minimum risk. H. (14pts) Assuming short selling is not allowed, for portfolio with ALL THREE securities: IL iv. (7) Construct the minimum variance portfolio frontier. (You will need at least 12-15 points on the portfolio frontier to draw a good scatter plot. You are aiming for a similar "Markowitz bullet" shape you observed in Question Fill, that is, make sure the curvature of your plot is visually distinguishable] (1) Assuming that investors prefer more to less and are risk avolders, indicate those sections of the diagram in part Hill that are efficient. (2) Find the composition and standard deviation for the efficient portfolio that has the same expected return as Security A. Add the two points corresponding to this efficient portfolio and Security A on the diagram in part Hill Note: In Part H, you must setup Solver parameters (will be checking these!): Objective Variable Cells Constraints Solver Parameters Set Objective To: T Max O value of By Changing Variable Cells: Subject to the Constraint Make Unconstrained Variables Non-Negative Select a Selving Method Solving Method GRC Nonlincar Add Change Delete Beast All Load/Save Options Select the GRG Nonlinear engine for Solver Problems that are smooth nonlinear. Select the LP Simplex engine for linear Solver Problems, and select the Evolutionary engine for Solver problems that are non-smooth. Help Sale Close
Step by Step Solution
There are 3 Steps involved in it
Step: 1

Get Instant Access to Expert-Tailored Solutions
See step-by-step solutions with expert insights and AI powered tools for academic success
Step: 2

Step: 3
Ace Your Homework with AI
Get the answers you need in no time with our AI-driven, step-by-step assistance
Get Started
Financial statements
Authors: Stephen Barrad
5th Edition
978-007802531, 9780324186383, 032418638X