

Answered step by step
Verified Expert Solution
Question
1 Approved Answer
see 8.11 for data 9.103 Homework assistance for accounting students. Refer to the Journal of Accounting Education (Vol. 25, 2007) study of assisting accounting students
see 8.11 for data 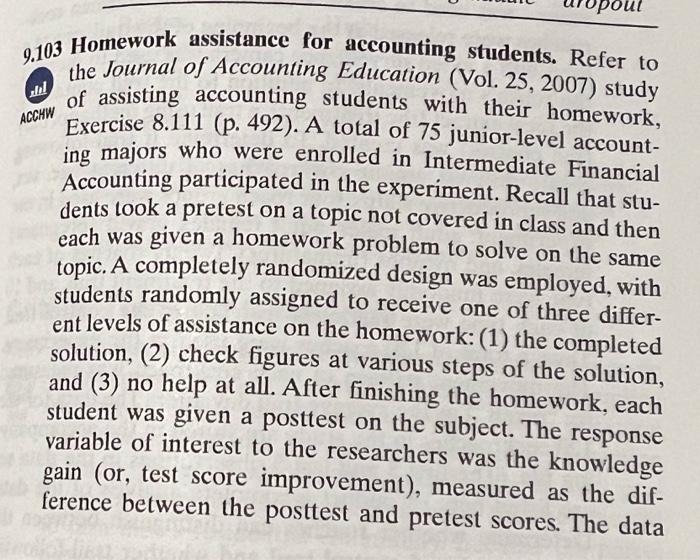
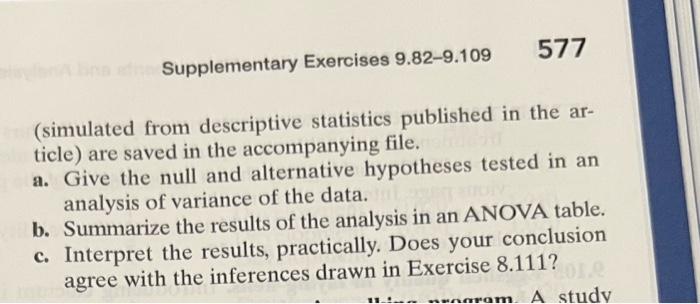
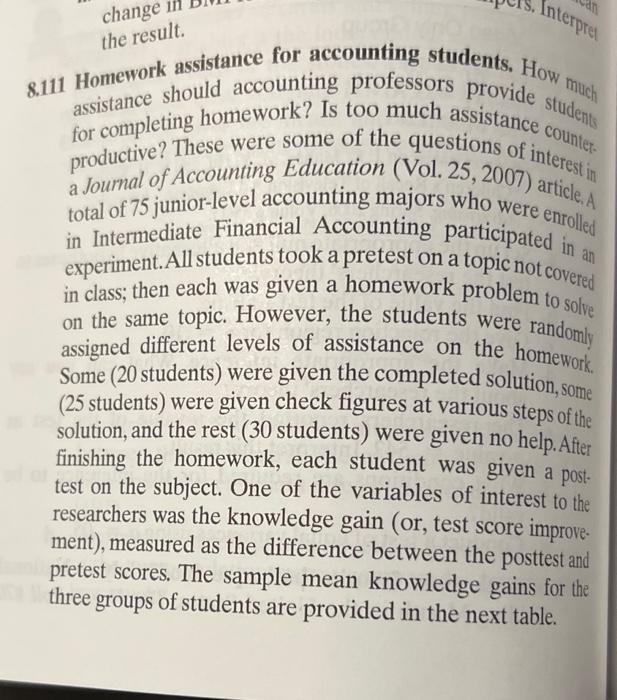
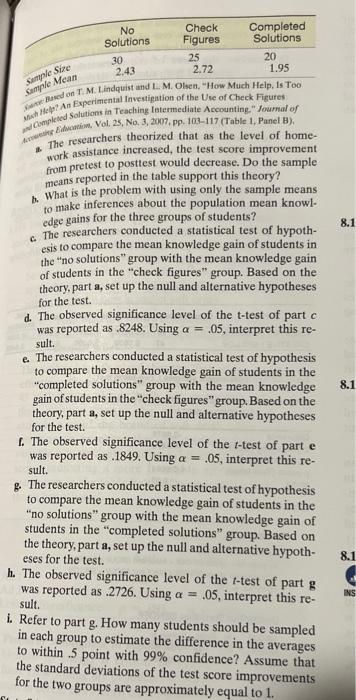
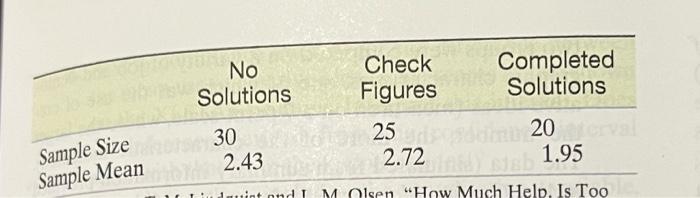
9.103 Homework assistance for accounting students. Refer to the Journal of Accounting Education (Vol. 25, 2007) study of assisting accounting students with their homework, Exercise 8.111 (p. 492). A total of 75 junior-level accounting majors who were enrolled in Intermediate Financial Accounting participated in the experiment. Recall that students took a pretest on a topic not covered in class and then each was given a homework problem to solve on the same topic. A completely randomized design was employed, with students randomly assigned to receive one of three different levels of assistance on the homework: (1) the completed solution, (2) check figures at various steps of the solution, and (3) no help at all. After finishing the homework, each student was given a posttest on the subject. The response variable of interest to the researchers was the knowledge gain (or, test score improvement), measured as the difference between the posttest and pretest scores. The data (simulated from descriptive statistics published in the article) are saved in the accompanying file. a. Give the null and alternative hypotheses tested in an analysis of variance of the data. b. Summarize the results of the analysis in an ANOVA table. c. Interpret the results, practically. Does your conclusion agree with the inferences drawn in Exercise 8.111? assistance-should accouns assistance for accotanting students, How mutch for completing homework? Is too much assistance counter. productive? These were some of the questions of interest in a Journal of Accounting Education (Vol. 25, 2007) article, A total of 75 junior-level accounting majors who were enrolled in Intermediate Financial Accounting participated in an experiment. All students took a pretest on a topic not covered in class; then each was given a homework problem to solve on the same topic. However, the students were randomly assigned different levels of assistance on the homework. Some ( 20 students) were given the completed solution, some ( 25 students) were given check figures at various steps of the solution, and the rest ( 30 students) were given no help. After finishing the homework, each student was given a posttest on the subject. One of the variables of interest to the researchers was the knowledge gain (or, test score improvement), measured as the difference between the posttest and pretest scores. The sample mean knowledge gains for the three groups of students are provided in the next table. The researchers theorized that as the level of homework assistance increased, the test score improvement from pretest to posttest would decrease. Do the sample means reported in the table support this theory? b. What is the problem with using only the sample means to make inferences about the population mean knowledge gains for the three groups of students? c. The researchers conducted a statistical test of hypothesis to compare the mean knowledge gain of students in the "no solutions" group with the mean knowledge gain of students in the "check figures" group. Based on the theory, part a, set up the null and alternative hypotheses for the test. d. The observed significance level of the t-test of part c was reported as .8248. Using =.05, interpret this result. e. The researchers conducted a statistical test of hypothesis to compare the mean knowledge gain of students in the "completed solutions" group with the mean knowledge gain of students in the "check figures" group. Based on the theory, part a, set up the null and alternative hypotheses for the test. f. The observed significance level of the t-test of part e was reported as . 1849. Using =.05, interpret this result. g. The researchers conducted a statistical test of hypothesis to compare the mean knowledge gain of students in the "no solutions" group with the mean knowledge gain of students in the "completed solutions" group. Based on the theory, part a, set up the null and alternative hypotheses for the test. h. The observed significance level of the t-test of part g was reported as .2726. Using =.05, interpret this resuilt, i. Refer to part g. How many students should be sampled in each group to estimate the difference in the averages to within .5 point with 99% confidence? Assume that the standard deviations of the test score improvements for the two groups are approximately equal to 1. \begin{tabular}{lccc} & NoSolutions & CheckFigures & CompletedSolutions \\ \hline Sample Size & 30 & 25 & 20 \\ Sample Mean & 2.43 & 2.72 & 1.95 \\ \hline \end{tabular} 9.103 Homework assistance for accounting students. Refer to the Journal of Accounting Education (Vol. 25, 2007) study of assisting accounting students with their homework, Exercise 8.111 (p. 492). A total of 75 junior-level accounting majors who were enrolled in Intermediate Financial Accounting participated in the experiment. Recall that students took a pretest on a topic not covered in class and then each was given a homework problem to solve on the same topic. A completely randomized design was employed, with students randomly assigned to receive one of three different levels of assistance on the homework: (1) the completed solution, (2) check figures at various steps of the solution, and (3) no help at all. After finishing the homework, each student was given a posttest on the subject. The response variable of interest to the researchers was the knowledge gain (or, test score improvement), measured as the difference between the posttest and pretest scores. The data (simulated from descriptive statistics published in the article) are saved in the accompanying file. a. Give the null and alternative hypotheses tested in an analysis of variance of the data. b. Summarize the results of the analysis in an ANOVA table. c. Interpret the results, practically. Does your conclusion agree with the inferences drawn in Exercise 8.111? assistance-should accouns assistance for accotanting students, How mutch for completing homework? Is too much assistance counter. productive? These were some of the questions of interest in a Journal of Accounting Education (Vol. 25, 2007) article, A total of 75 junior-level accounting majors who were enrolled in Intermediate Financial Accounting participated in an experiment. All students took a pretest on a topic not covered in class; then each was given a homework problem to solve on the same topic. However, the students were randomly assigned different levels of assistance on the homework. Some ( 20 students) were given the completed solution, some ( 25 students) were given check figures at various steps of the solution, and the rest ( 30 students) were given no help. After finishing the homework, each student was given a posttest on the subject. One of the variables of interest to the researchers was the knowledge gain (or, test score improvement), measured as the difference between the posttest and pretest scores. The sample mean knowledge gains for the three groups of students are provided in the next table. The researchers theorized that as the level of homework assistance increased, the test score improvement from pretest to posttest would decrease. Do the sample means reported in the table support this theory? b. What is the problem with using only the sample means to make inferences about the population mean knowledge gains for the three groups of students? c. The researchers conducted a statistical test of hypothesis to compare the mean knowledge gain of students in the "no solutions" group with the mean knowledge gain of students in the "check figures" group. Based on the theory, part a, set up the null and alternative hypotheses for the test. d. The observed significance level of the t-test of part c was reported as .8248. Using =.05, interpret this result. e. The researchers conducted a statistical test of hypothesis to compare the mean knowledge gain of students in the "completed solutions" group with the mean knowledge gain of students in the "check figures" group. Based on the theory, part a, set up the null and alternative hypotheses for the test. f. The observed significance level of the t-test of part e was reported as . 1849. Using =.05, interpret this result. g. The researchers conducted a statistical test of hypothesis to compare the mean knowledge gain of students in the "no solutions" group with the mean knowledge gain of students in the "completed solutions" group. Based on the theory, part a, set up the null and alternative hypotheses for the test. h. The observed significance level of the t-test of part g was reported as .2726. Using =.05, interpret this resuilt, i. Refer to part g. How many students should be sampled in each group to estimate the difference in the averages to within .5 point with 99% confidence? Assume that the standard deviations of the test score improvements for the two groups are approximately equal to 1. \begin{tabular}{lccc} & NoSolutions & CheckFigures & CompletedSolutions \\ \hline Sample Size & 30 & 25 & 20 \\ Sample Mean & 2.43 & 2.72 & 1.95 \\ \hline \end{tabular} Step by Step Solution
There are 3 Steps involved in it
Step: 1

Get Instant Access to Expert-Tailored Solutions
See step-by-step solutions with expert insights and AI powered tools for academic success
Step: 2

Step: 3
Ace Your Homework with AI
Get the answers you need in no time with our AI-driven, step-by-step assistance
Get Started
Financial Statements The Ultimate Guide To Financial Statements Analysis For Business Owners And Investors
Authors: Greg Shields
1st Edition
172643320X, 978-1726433204