Answered step by step
Verified Expert Solution
Link Copied!

Question

1 Approved Answer

see attached 2. (34 pts) Two local producers of face masks can produce each a maximum of 100 (thousands) in a month at the at

see attached
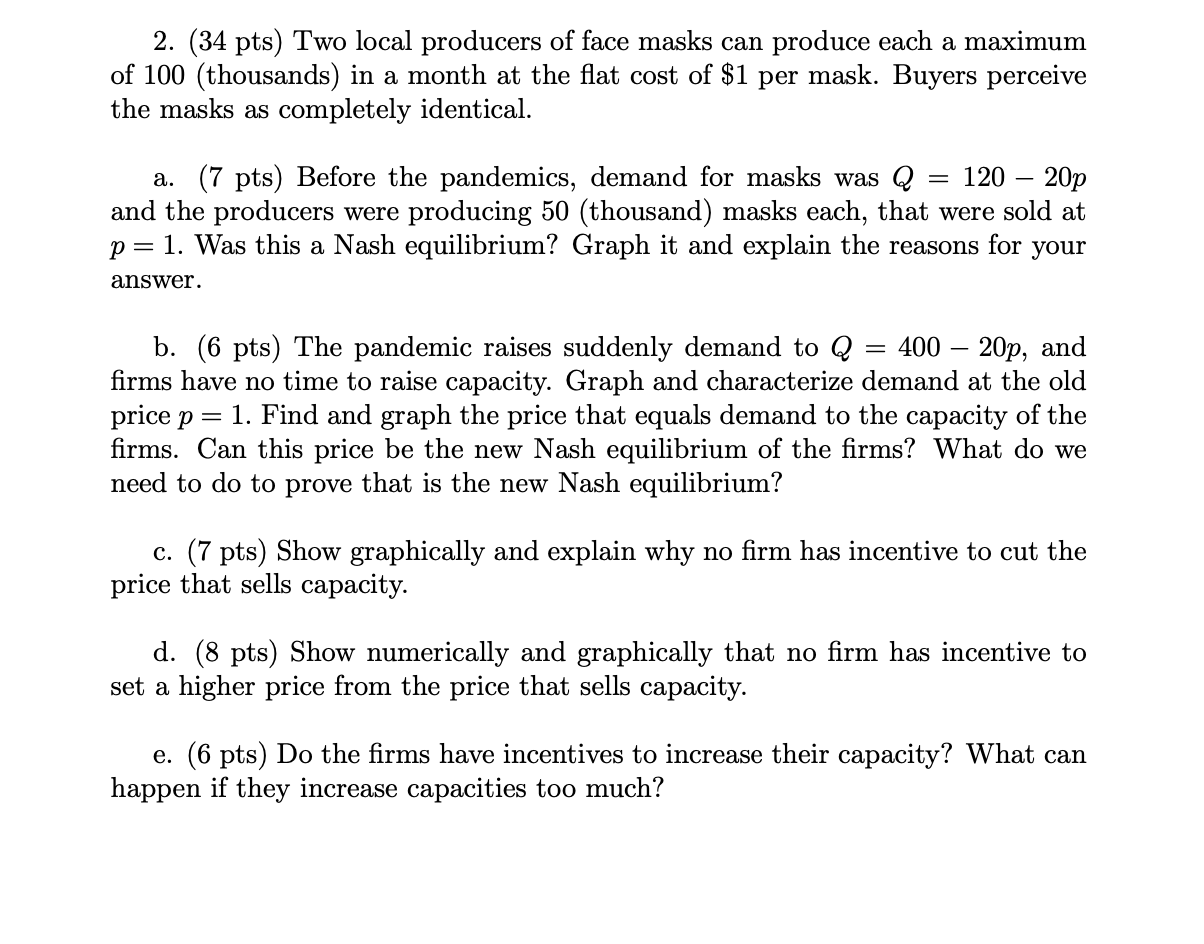
image text in transcribed
2. (34 pts) Two local producers of face masks can produce each a maximum of 100 (thousands) in a month at the at cost of $1 per mask. Buyers perceive the masks as completely identical. a. (7 pts) Before the pandemics, demand for masks was Q = 120 20p and the producers were producing 50 (thousand) masks each, that were sold at p = 1. Was this a Nash equilibrium? Graph it and explain the reasons for your answer. b. (6 pts) The pandemic raises suddenly demand to Q = 400 20p, and rms have no time to raise capacity. Graph and characterize demand at the old price p = 1. Find and graph the price that equals demand to the capacity of the rms. Can this price be the new Nash equilibrium of the rms? What do we need to do to prove that is the new Nash equilibrium? c. (7 pts) Show graphically and explain why no rm has incentive to cut the price that sells capacity. (1. (8 pts) Show numerically and graphically that no rm has incentive to set a higher price from the price that sells capacity. e. (6 pts) Do the rms have incentives to increase their capacity? What can happen if they increase capacities too much

Step by Step Solution

There are 3 Steps involved in it

Step: 1

blur-text-image

Get Instant Access to Expert-Tailored Solutions

See step-by-step solutions with expert insights and AI powered tools for academic success

Step: 2

blur-text-image

Step: 3

blur-text-image

Ace Your Homework with AI

Get the answers you need in no time with our AI-driven, step-by-step assistance

Get Started

Recommended Textbook for

International Economics Theory and Policy

Authors: Paul R. Krugman, Maurice Obstfeld, Marc J. Melitz

9th Edition

978-0132146654, 0132146657, 9780273754091, 978-0273754206

More Books

Students also viewed these Economics questions