See attached thanks!
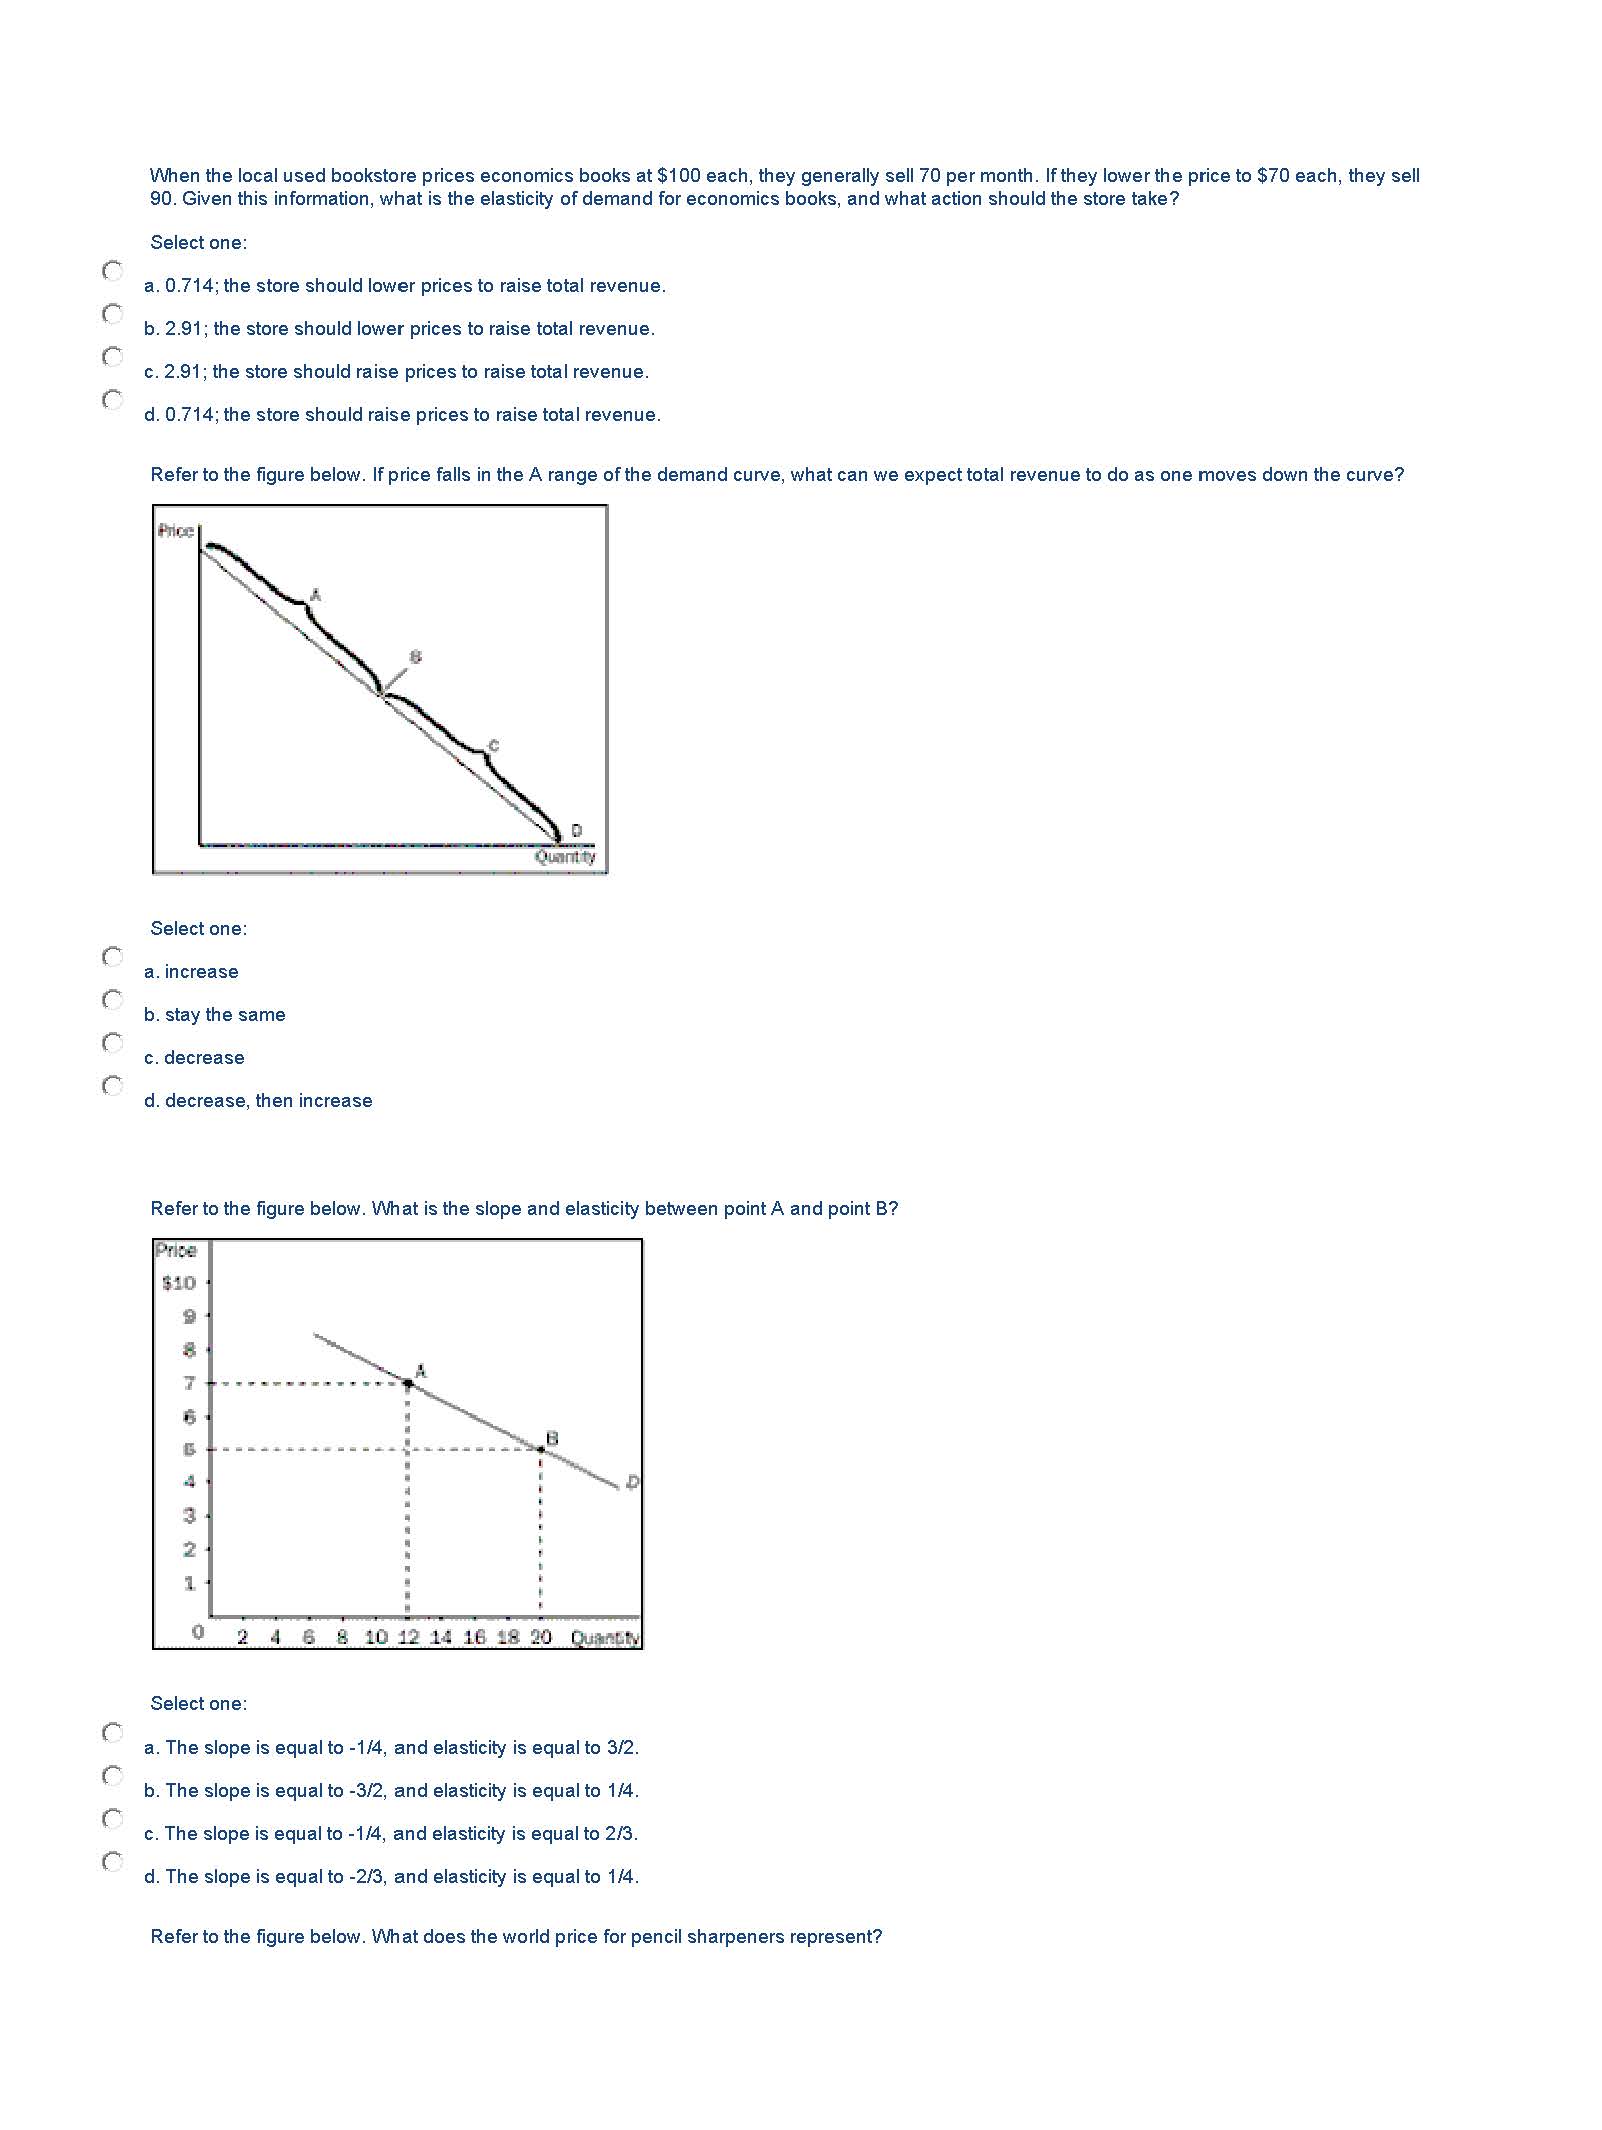
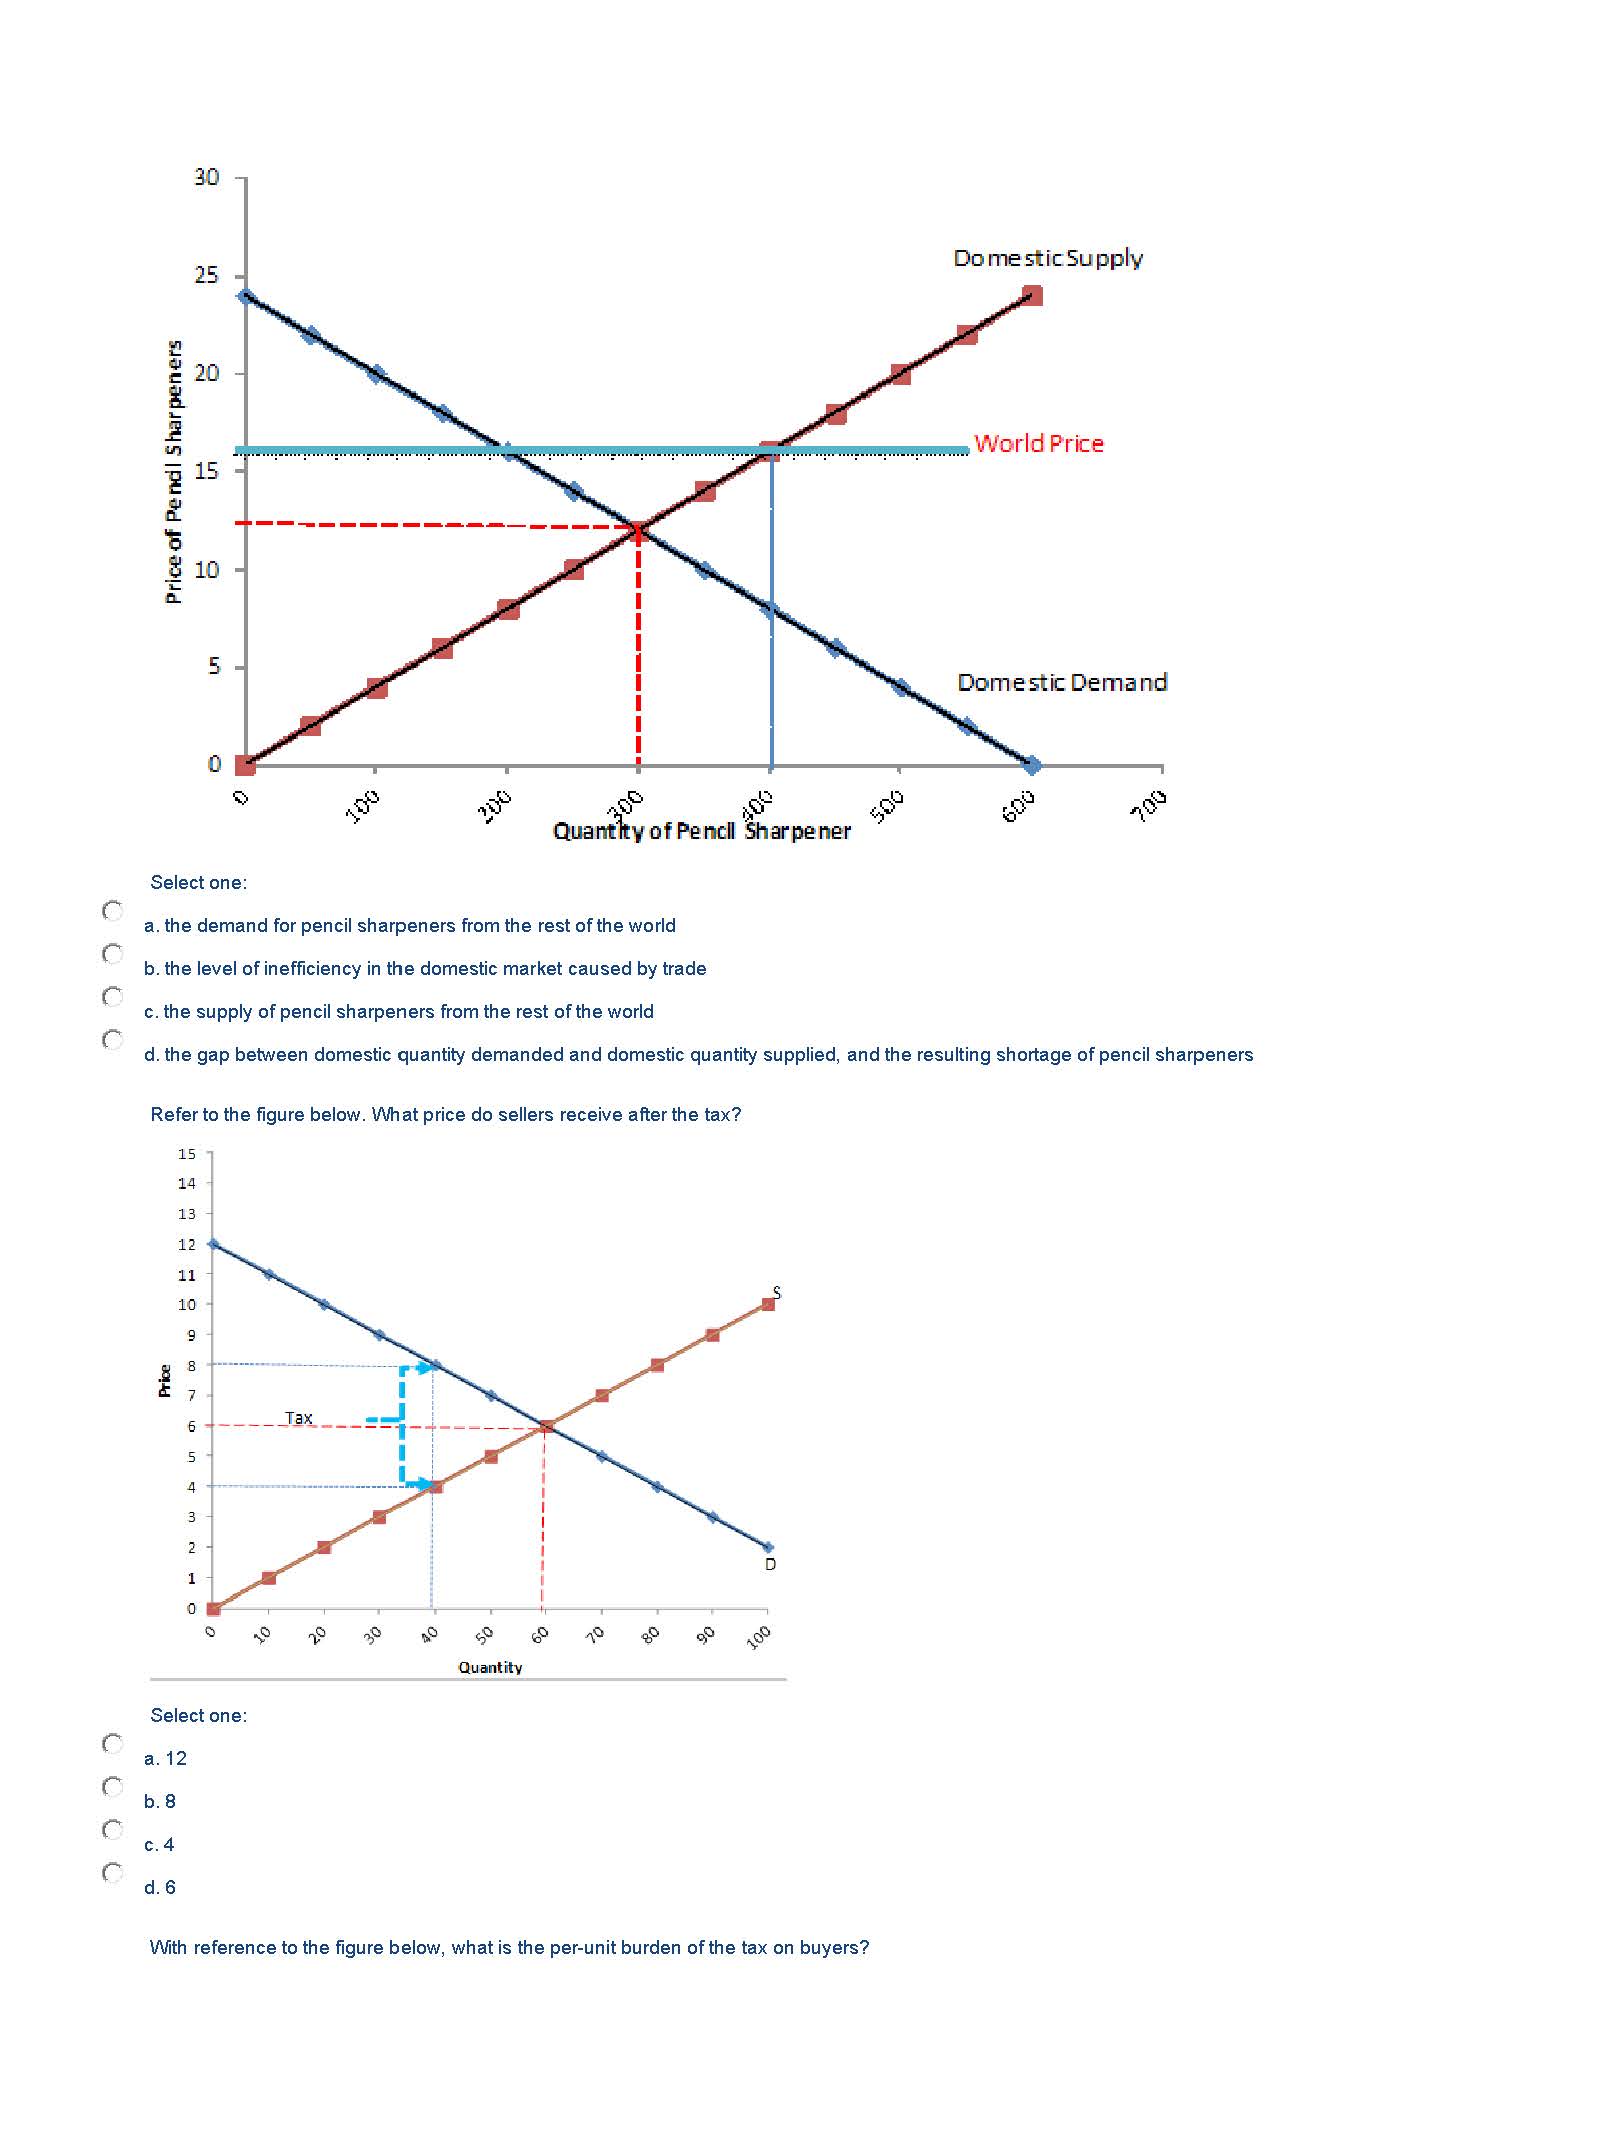
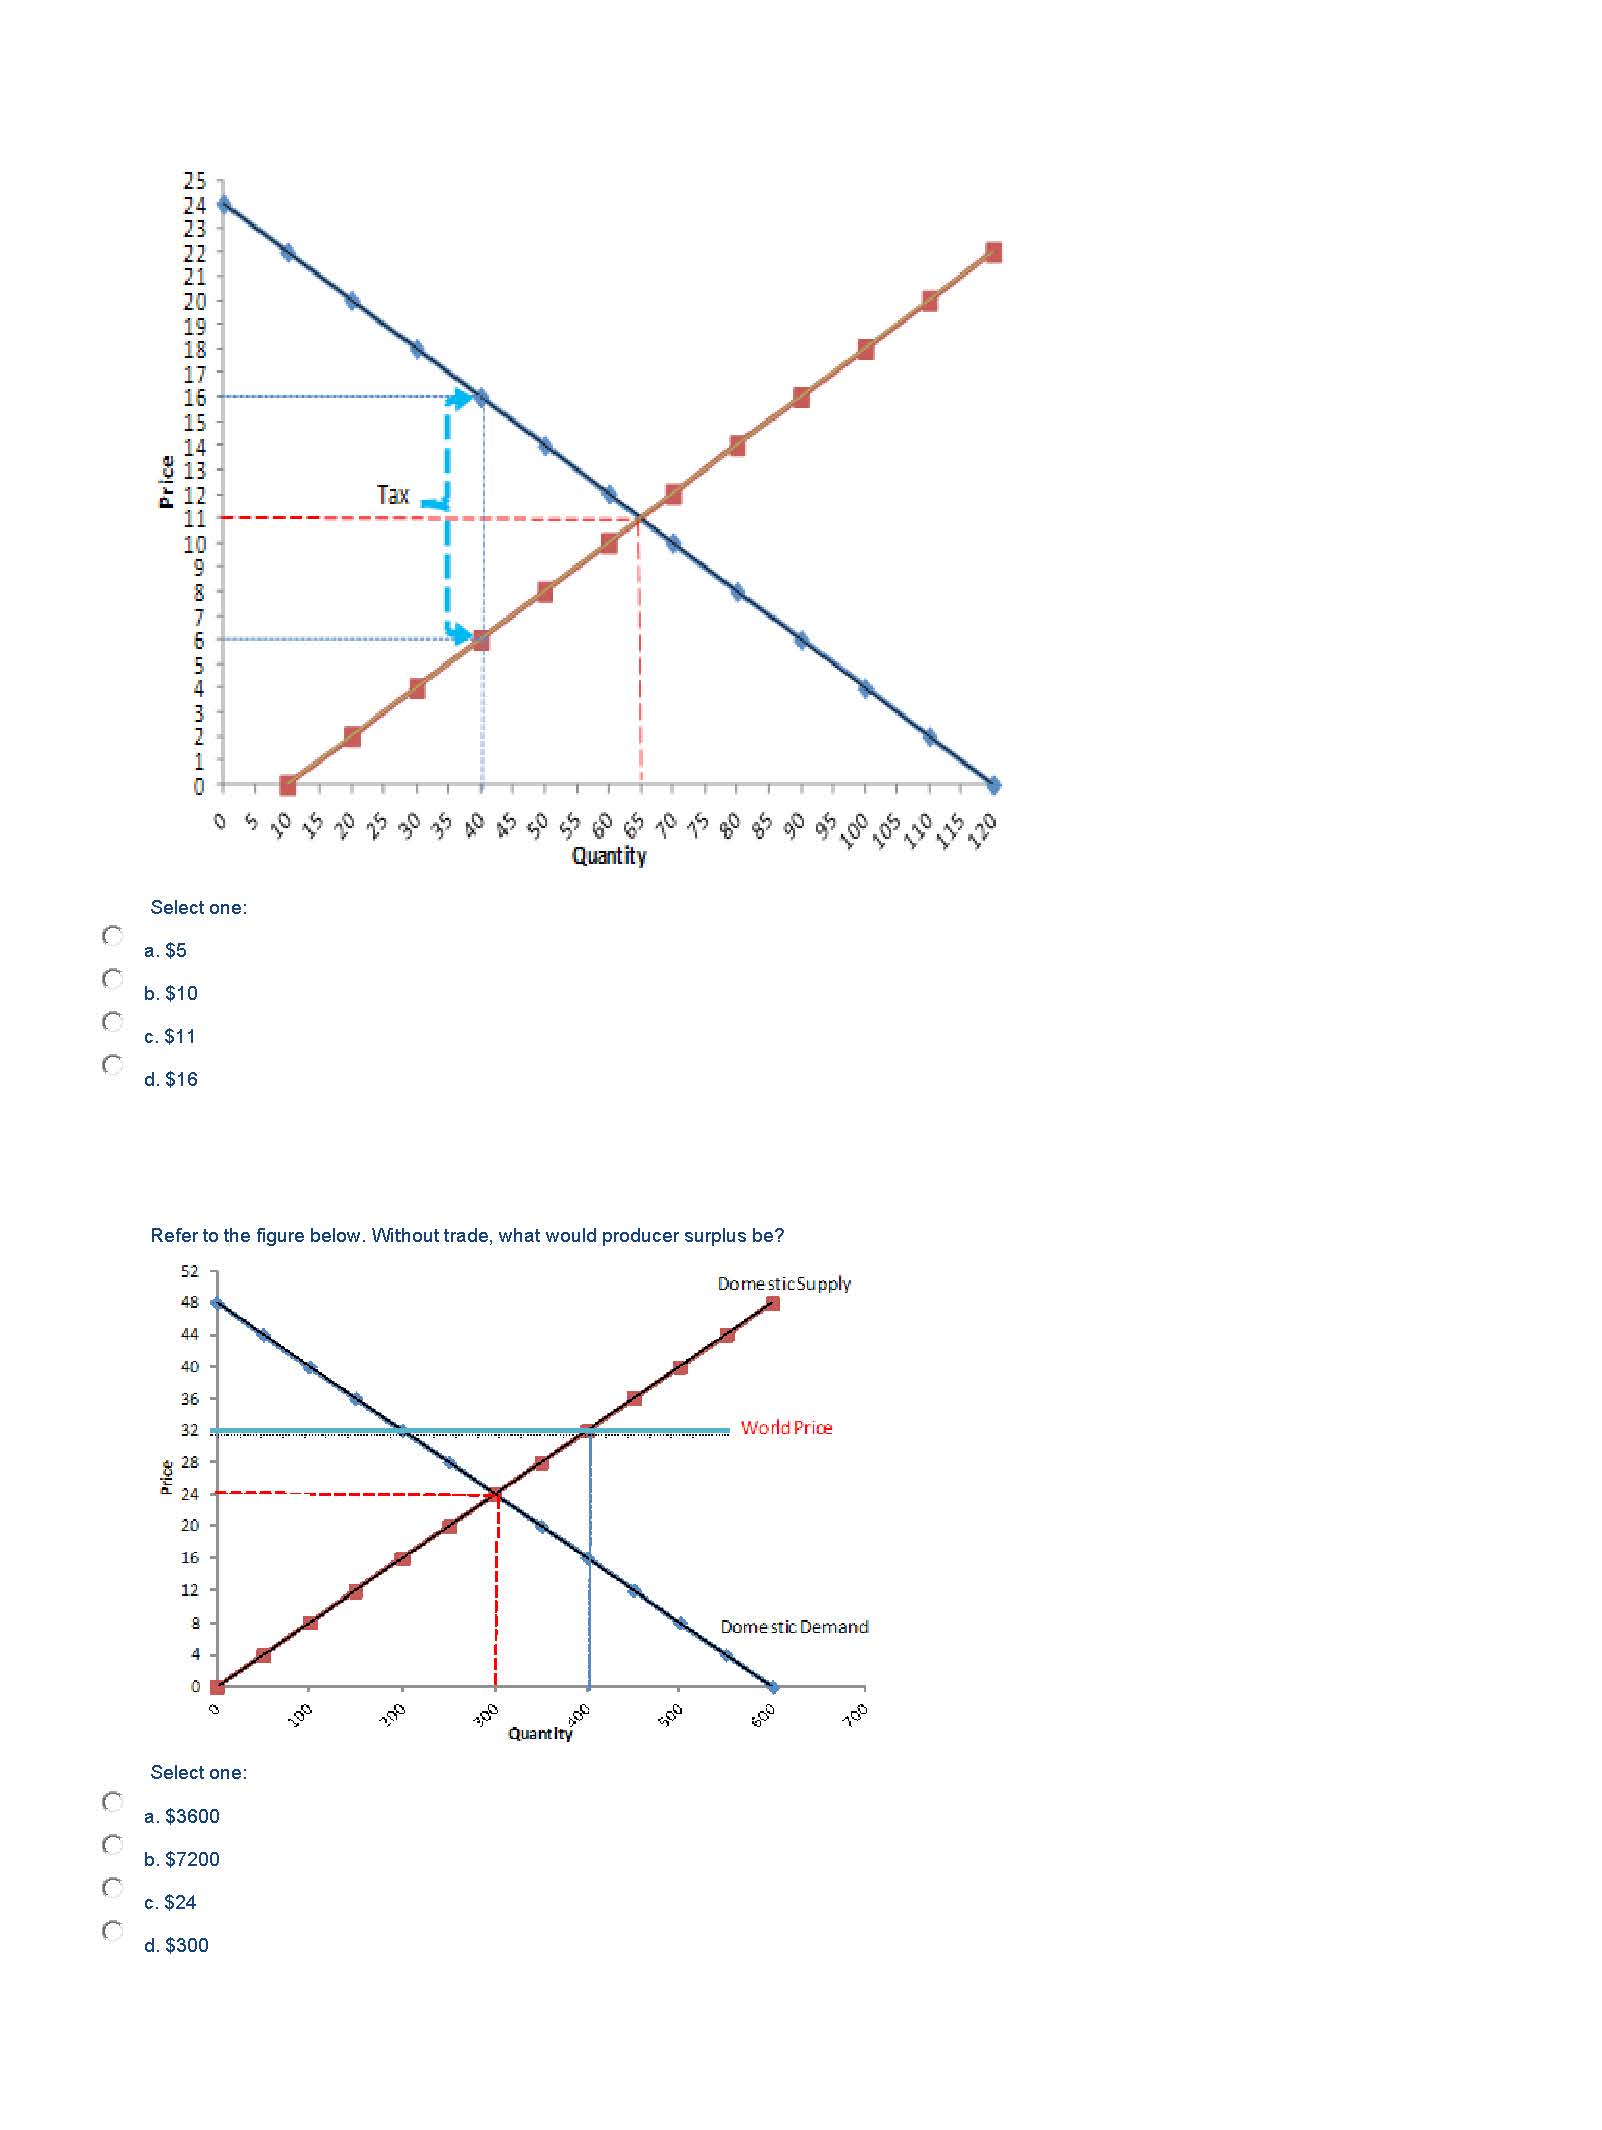
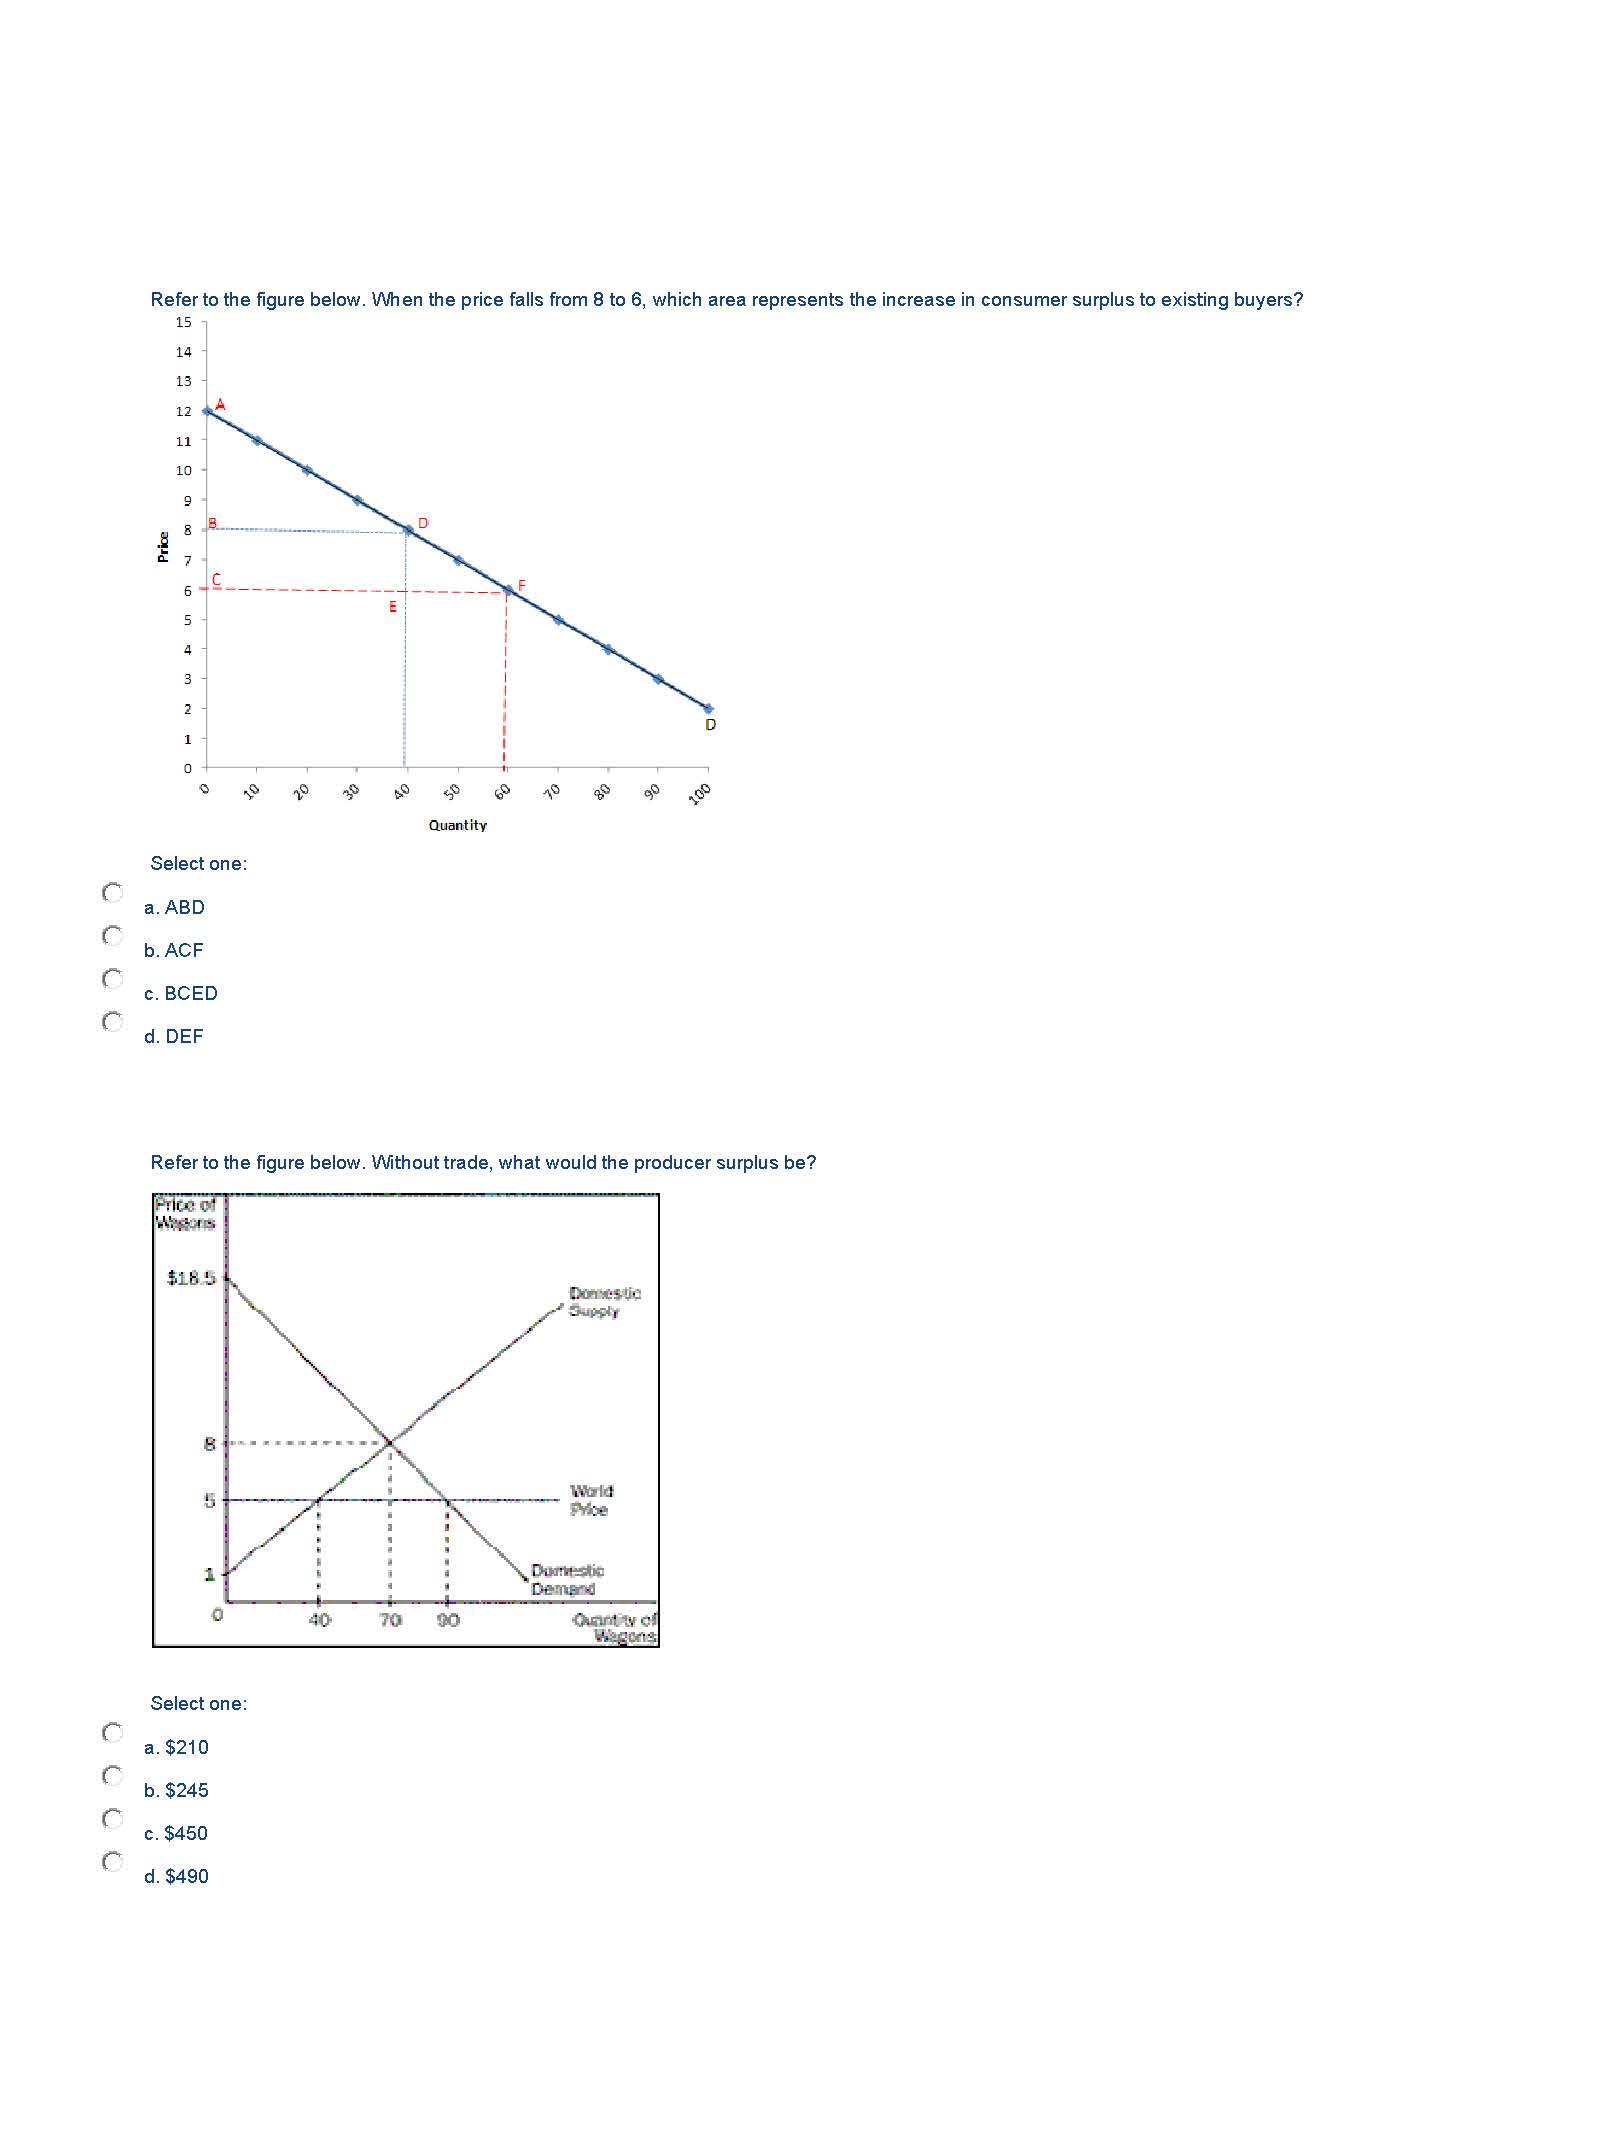
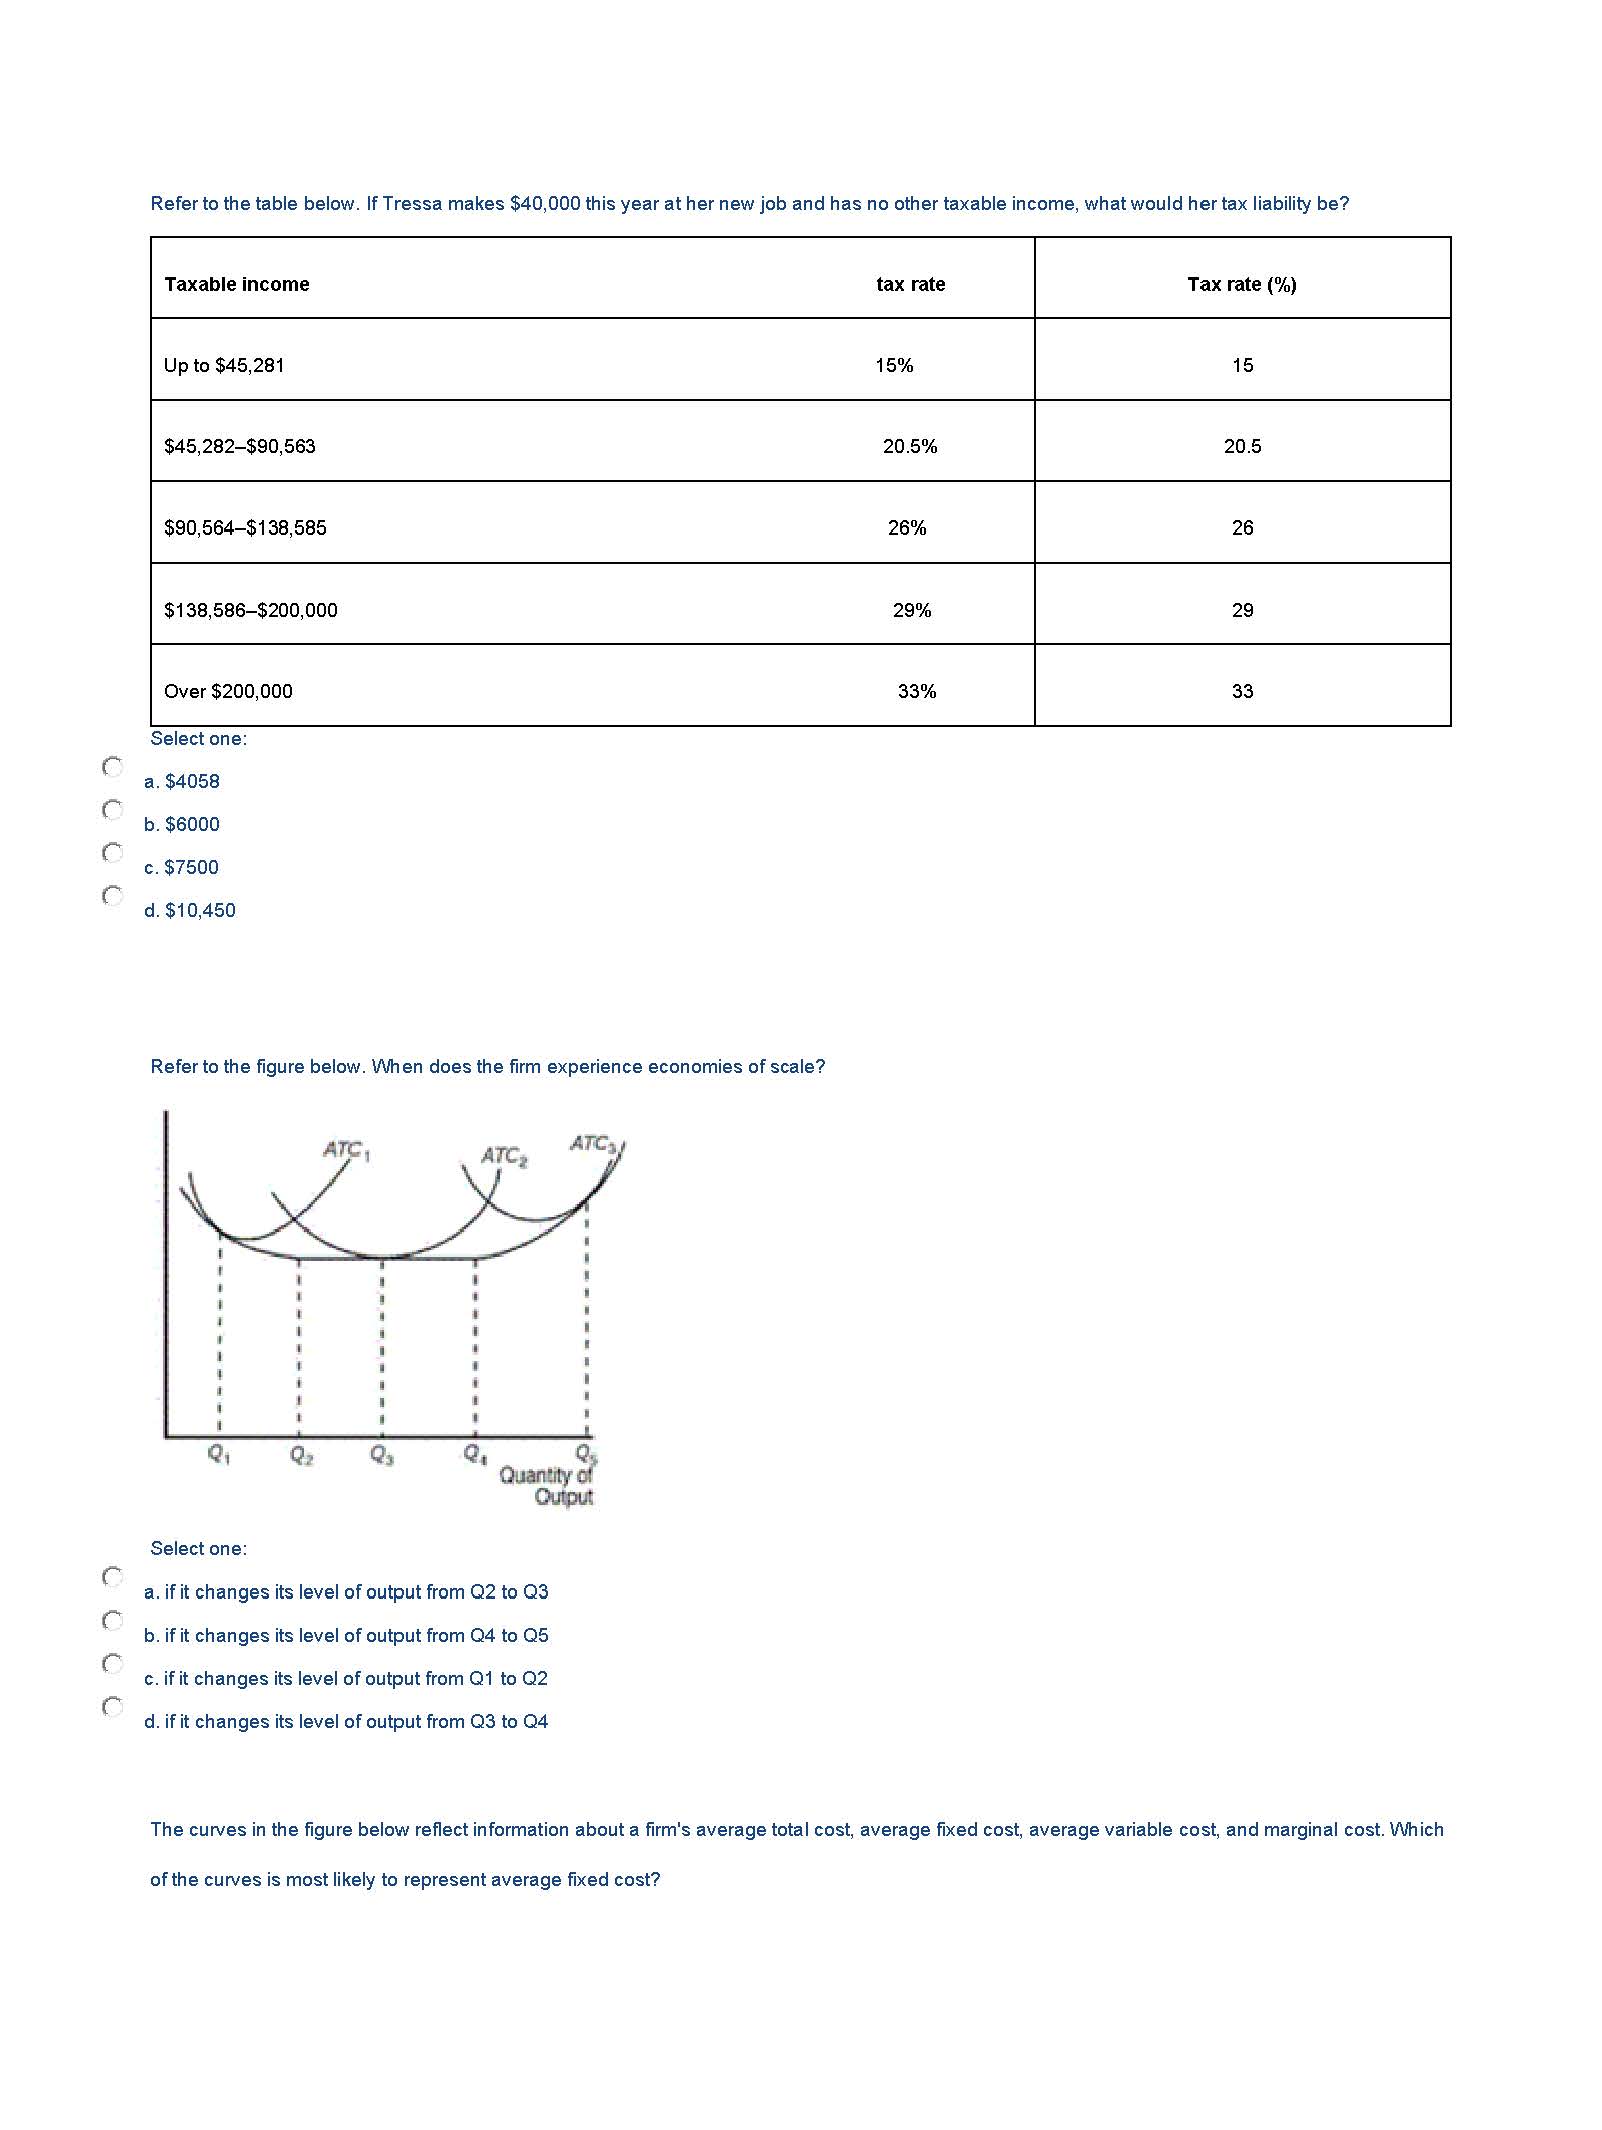
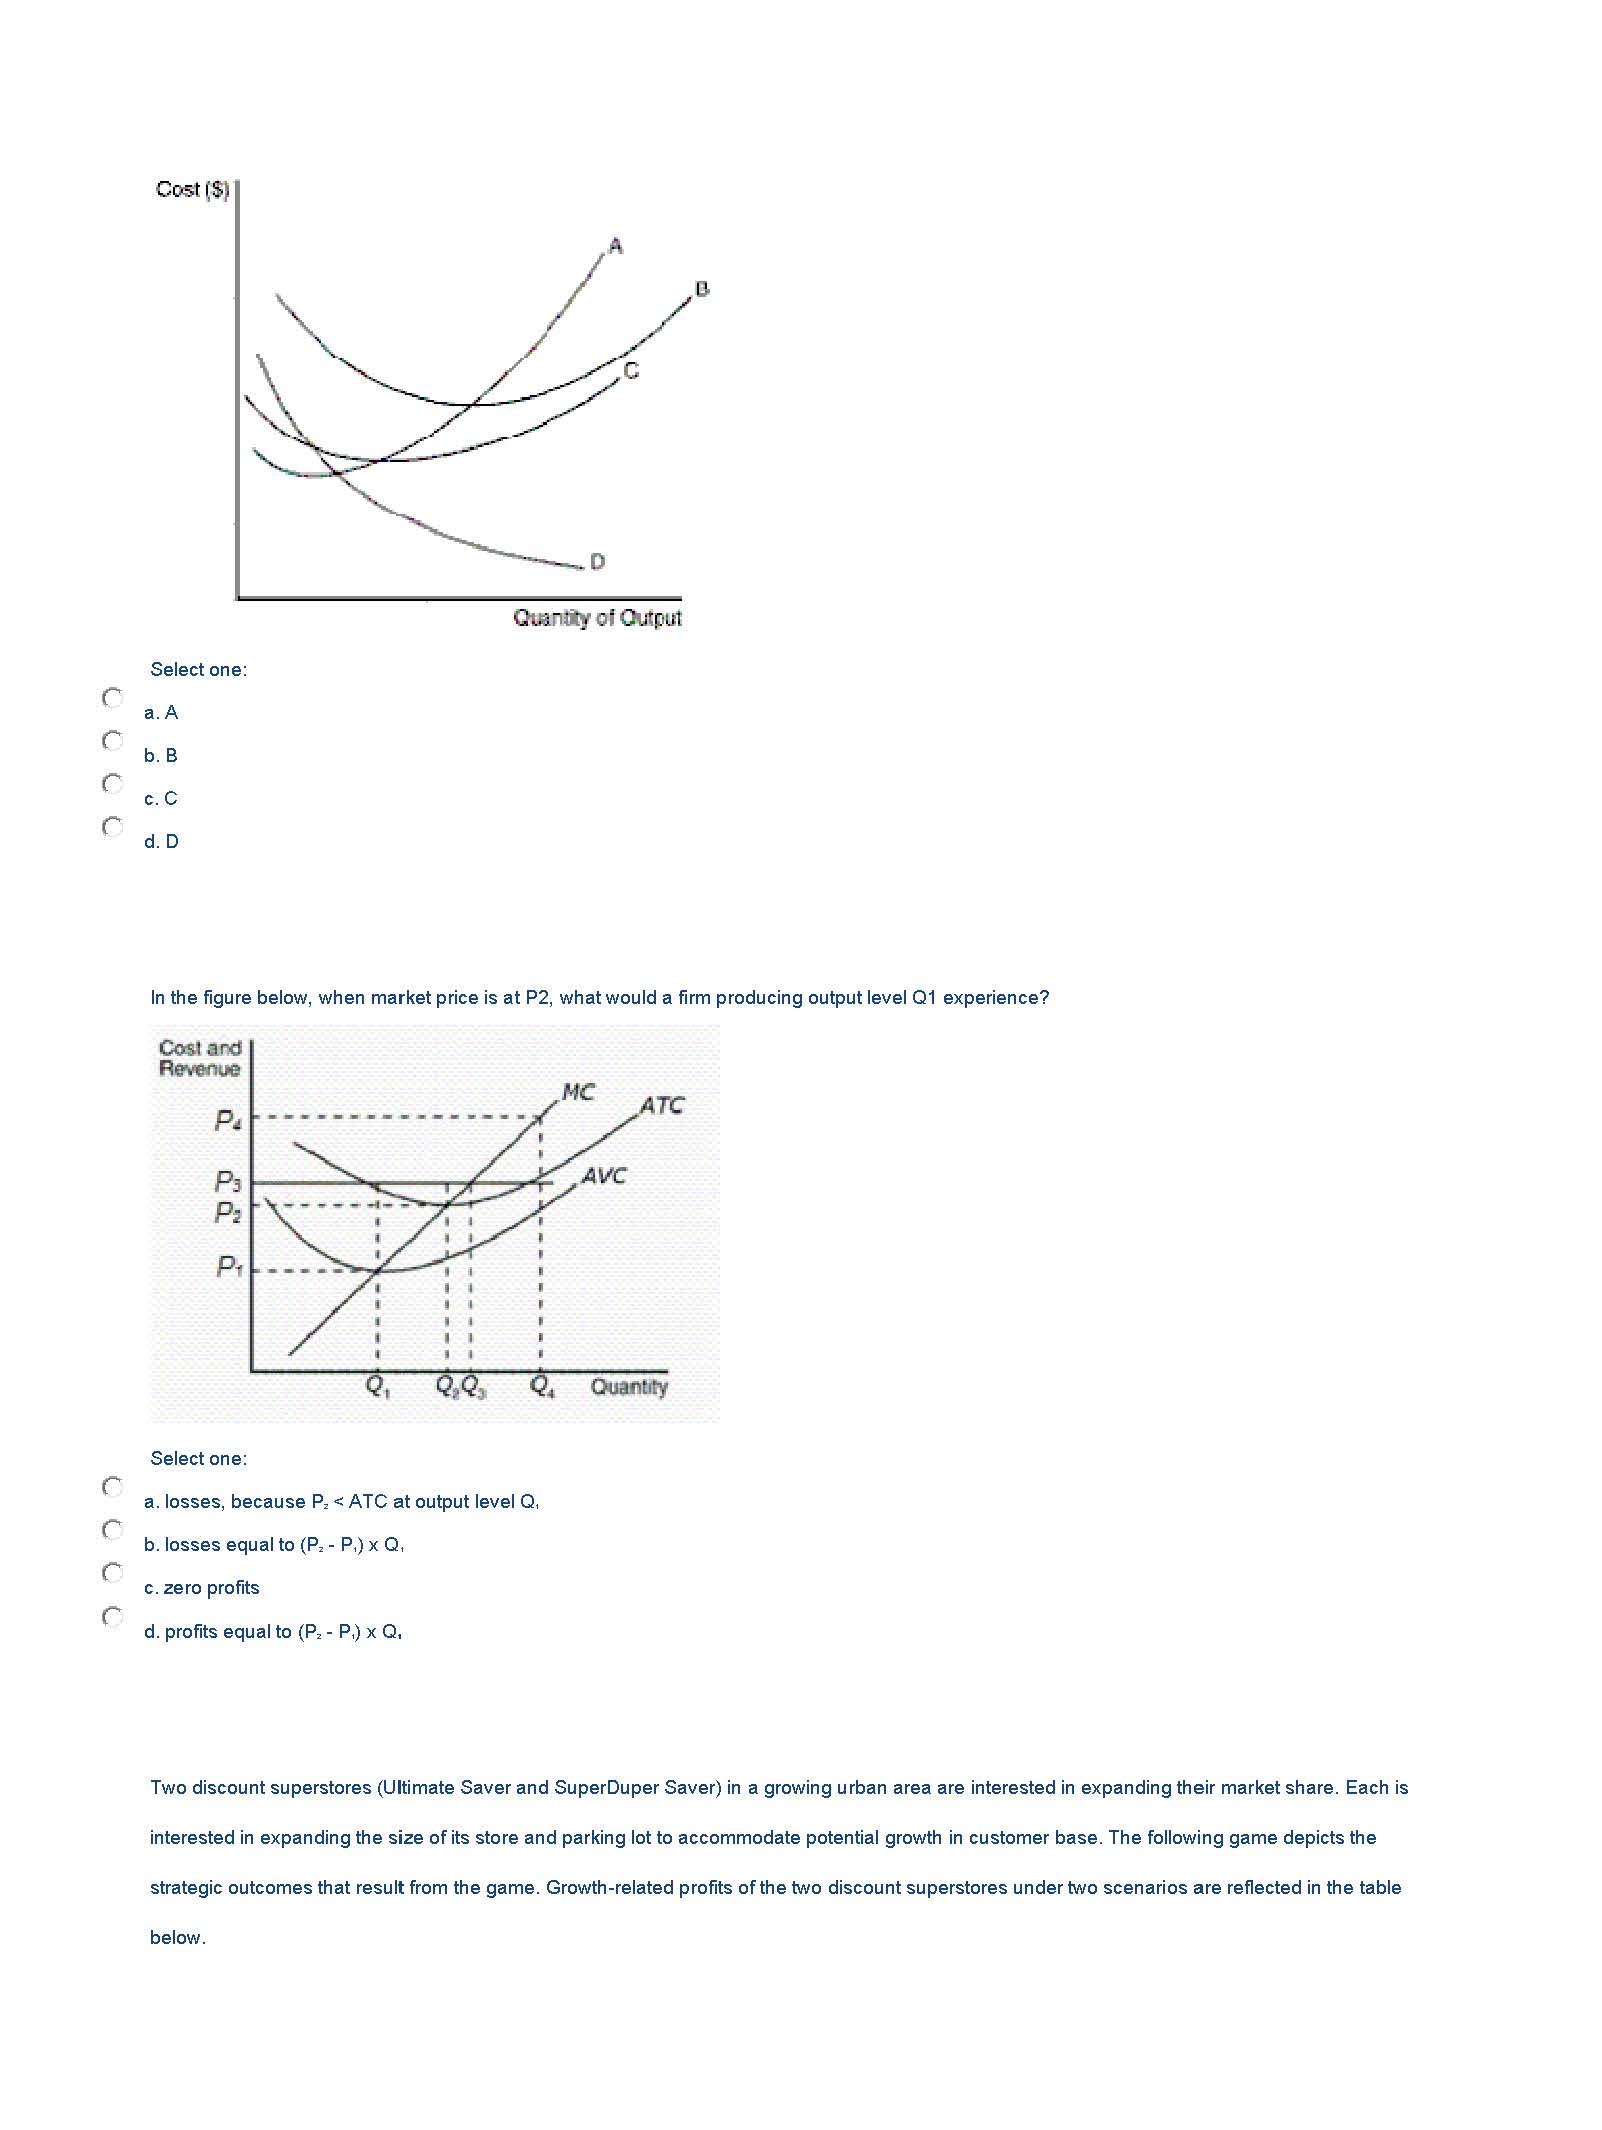
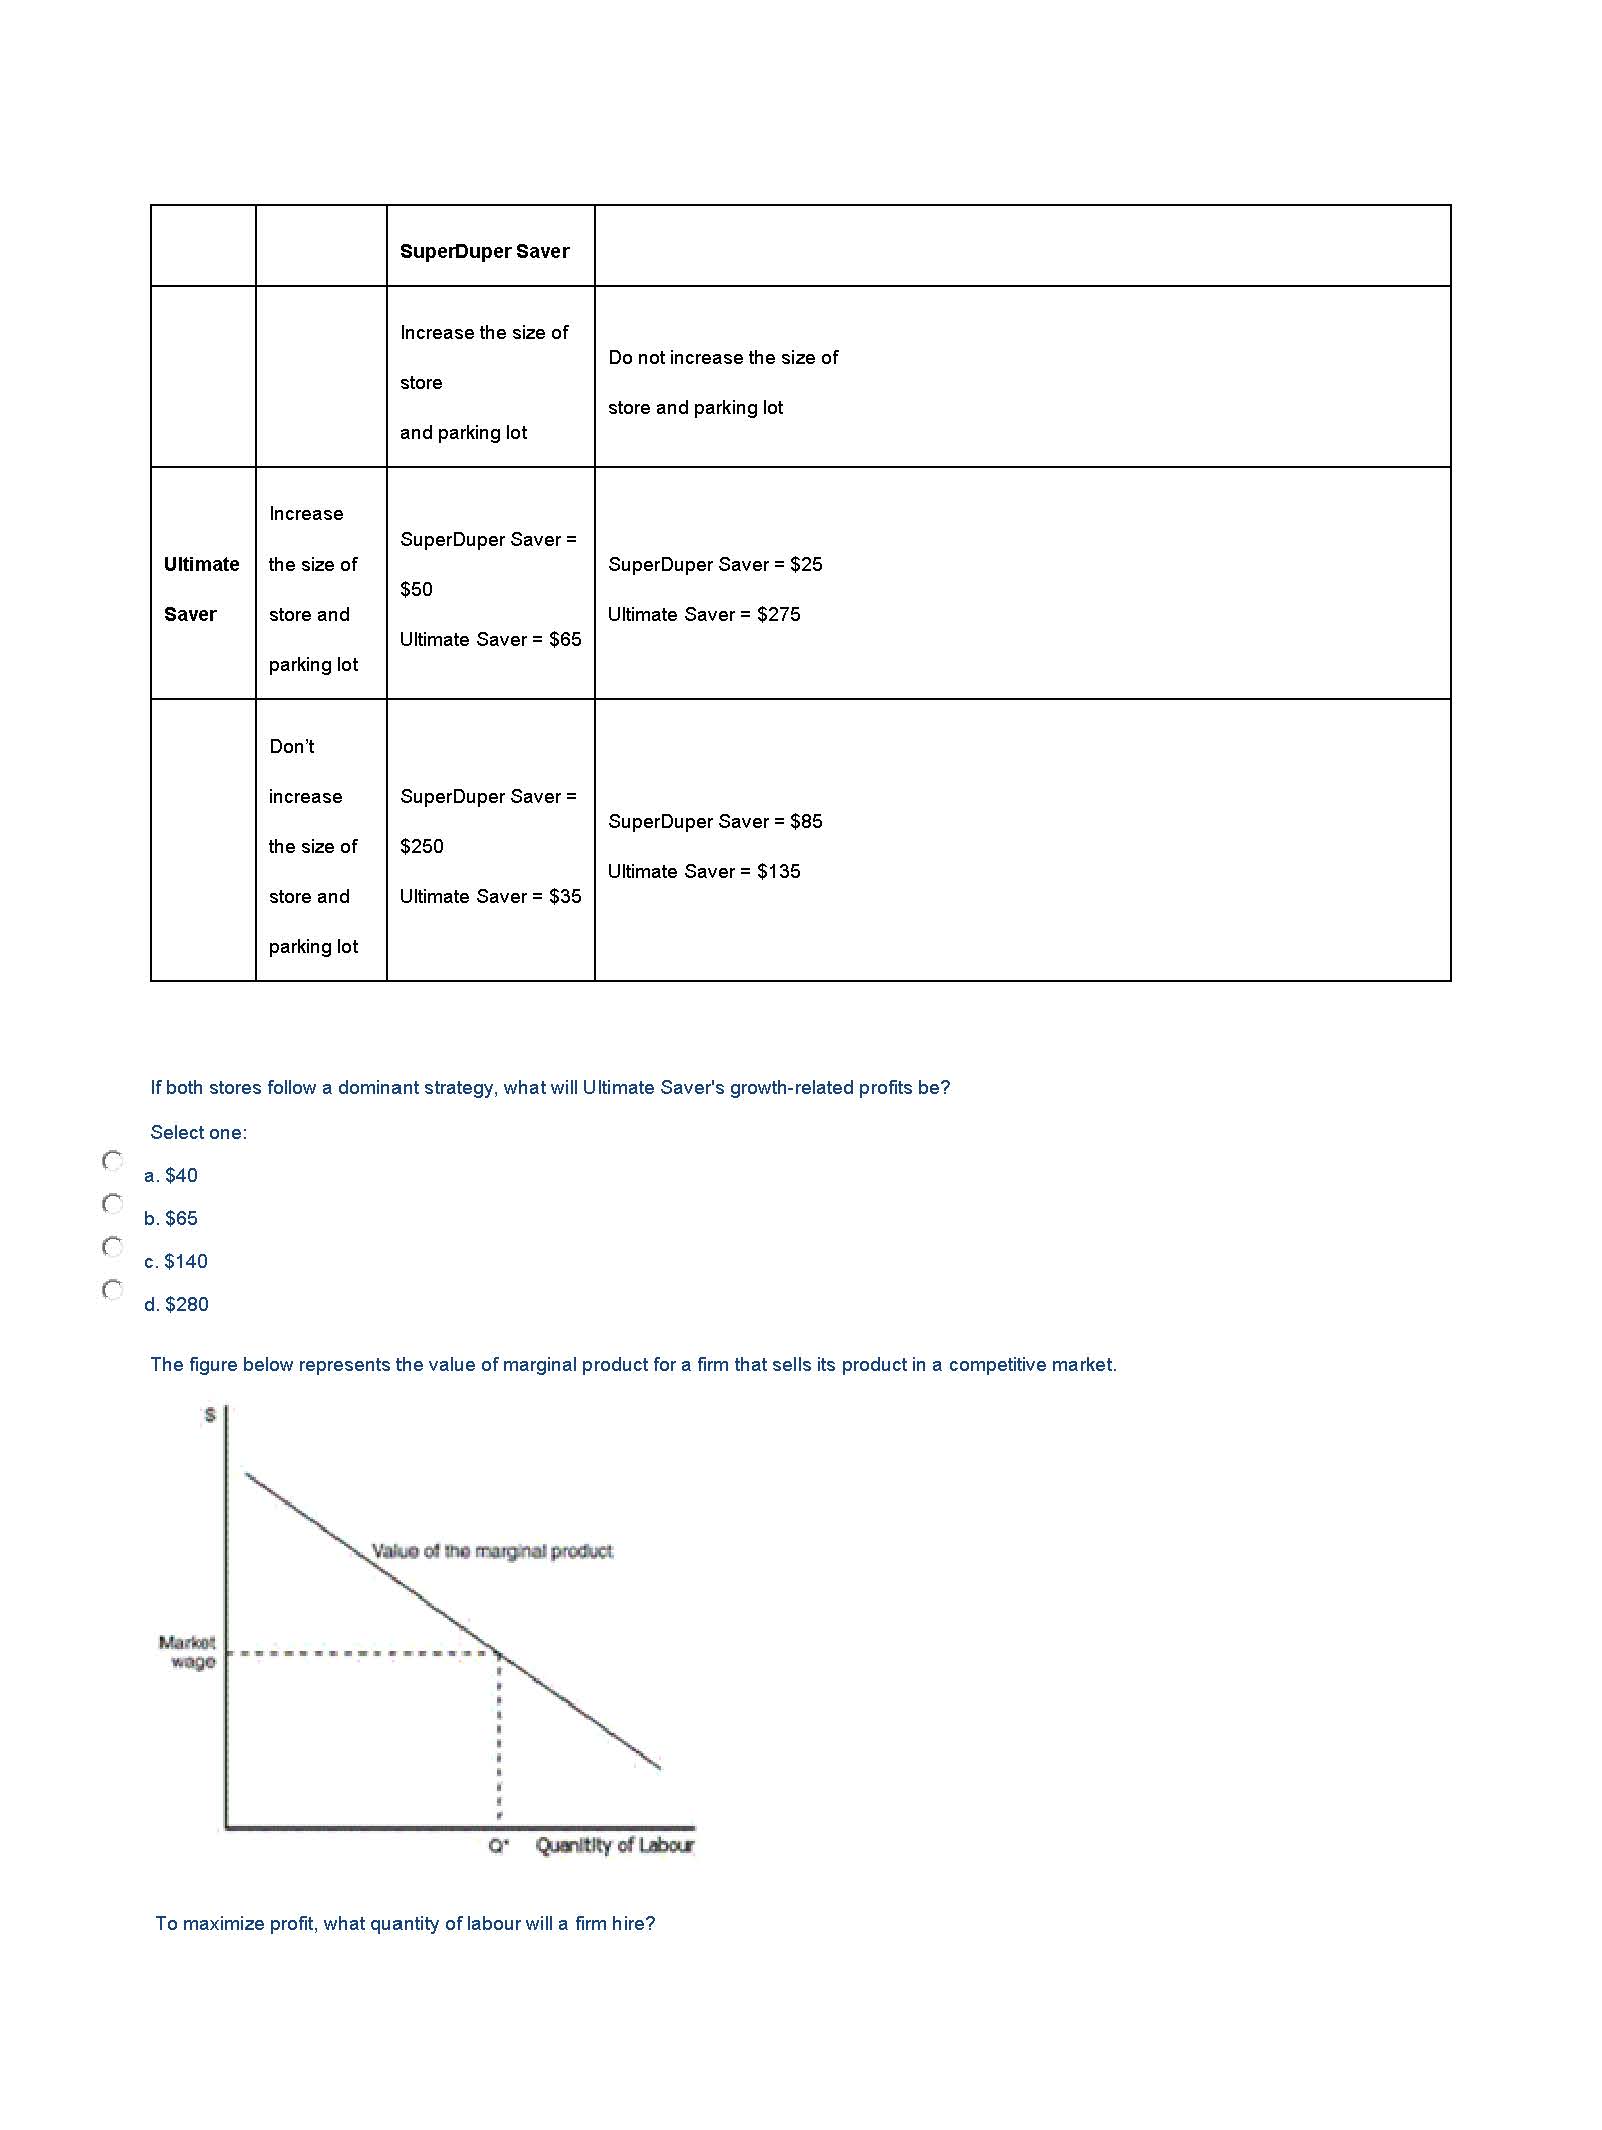
When the local used bookstore prices economics books at $100 each, they generally sell 70 per month. If they lower the price to $70 each, they sell 90. Given this information, what is the elasticity of demand for economics books, and what action should the store take? Select one: C a. 0.714; the store should lower prices to raise total revenue. b. 2.91; the store should lower prices to raise total revenue. c. 2.91; the store should raise prices to raise total revenue d. 0.714; the store should raise prices to raise total revenue Refer to the figure below. If price falls in the A range of the demand curve, what can we expect total revenue to do as one moves down the curve? Price Quantity Select one: a. increase b. stay the same c. decrease d. decrease, then increase Refer to the figure below. What is the slope and elasticity between point A and point B? Price $10 HNUADO 8 10 12 14 16 18 20 Quantity Select one: a. The slope is equal to -1/4, and elasticity is equal to 3/2. b. The slope is equal to -3/2, and elasticity is equal to 1/4. c. The slope is equal to -1/4, and elasticity is equal to 2/3. d. The slope is equal to -2/3, and elasticity is equal to 1/4. Refer to the figure below. What does the world price for pencil sharpeners represent?30 25 DomesticSupply Price of Pendl Sharpeners 20 15 :wwwwwwwww.. World Price 10 Domestic Demand 0 Quantity of Pencil Sharpener Select one: a. the demand for pencil sharpeners from the rest of the world b. the level of inefficiency in the domestic market caused by trade c. the supply of pencil sharpeners from the rest of the world d. the gap between domestic quantity demanded and domestic quantity supplied, and the resulting shortage of pencil sharpeners Refer to the figure below. What price do sellers receive after the tax? 15 Price Tax N W - co 100 Quantity Select one: a . 12 b. 8 c. 4 d. 6 With reference to the figure below, what is the per-unit burden of the tax on buyers?Price Tax 100 105 115 110 120 Quantity Select one: a. $ b. $10 c. $11 d. $16 Refer to the figure below. Without trade, what would producer surplus be? 52 DomesticSupply 48 44 40 36 32 & 28 2 24 20 16 12 Domestic Demand quantity" Select one: a. $3600 b. $7200 c. $24 d. $300Refer to the figure below. When the price falls from 8 to 6, which area represents the increase in consumer surplus to existing buyers? 15 7 14 12 Price JOHNWP Quantity Select one: a. ABD b. ACF c. BCED d. DEF Refer to the figure below. Without trade, what would the producer surplus be? Price of $185 Dontestic Supply Domestic Demand 40 70 Wagons Select one: a. $210 b. $245 c. $450 d. $490Refer to the table below. If Tressa makes $40,000 this year at her new job and has no other taxable income, what would her tax liability be? Taxable income tax rate Tax rate (%) Up to $45,281 15% 15 $45,282-$90,563 20.5% 20.5 $90,564-$138,585 26% 26 $138,586-$200,000 29% 29 Over $200,000 33% 33 Select one: a. $4058 b. $6000 c. $7500 d. $10,450 Refer to the figure below. When does the firm experience economies of scale? ATC, ATC ATCy Q1 Q2 Q3 Quantity of Output Select one: a. if it changes its level of output from Q2 to Q3 b. if it changes its level of output from Q4 to Q5 c. if it changes its level of output from Q1 to Q2 d. if it changes its level of output from Q3 to Q4 The curves in the figure below reflect information about a firm's average total cost, average fixed cost, average variable cost, and marginal cost. Which of the curves is most likely to represent average fixed cost?Cost ($) . D Quantity of Output Select one: a . A b. B c. C d. D In the figure below, when market price is at P2, what would a firm producing output level Q1 experience? Cost and Revenue P p PP Select one: a. losses, because P,
