SEE INSERTED TABLE BELOW FOR VALUES AS NEEDED:
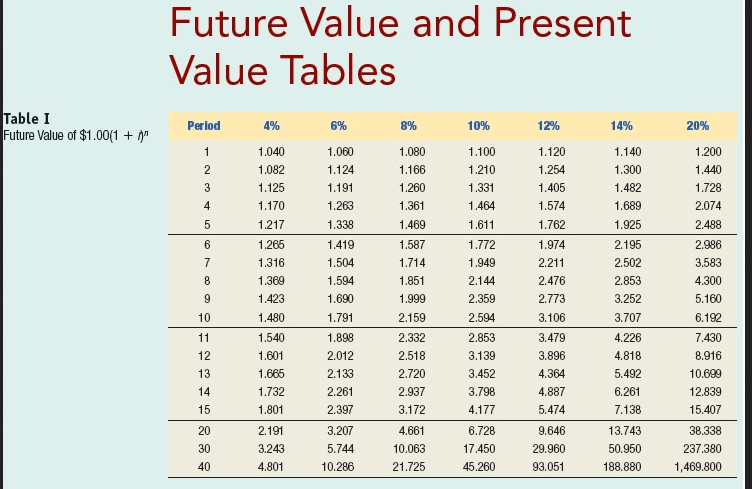
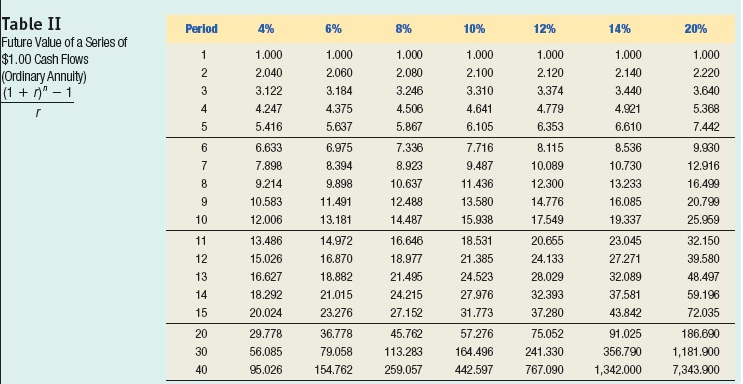
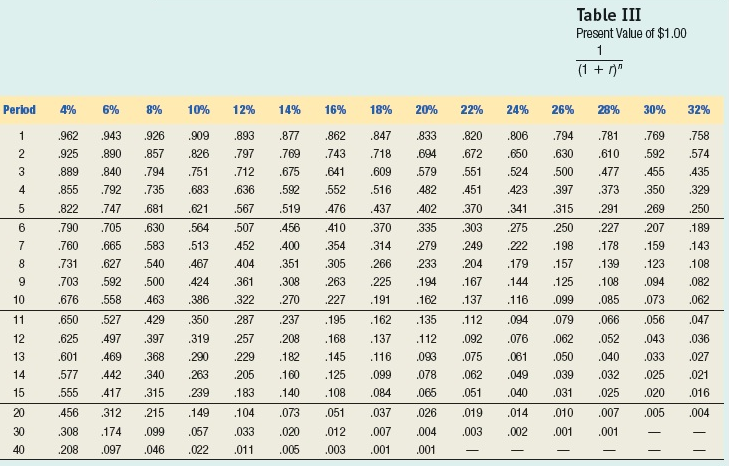
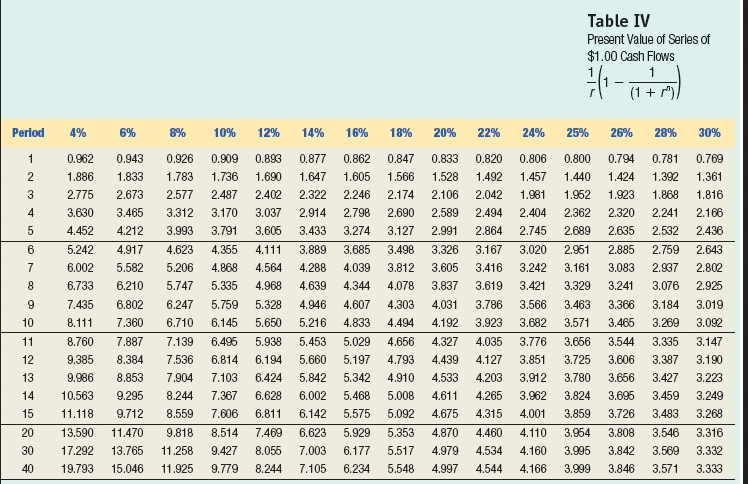
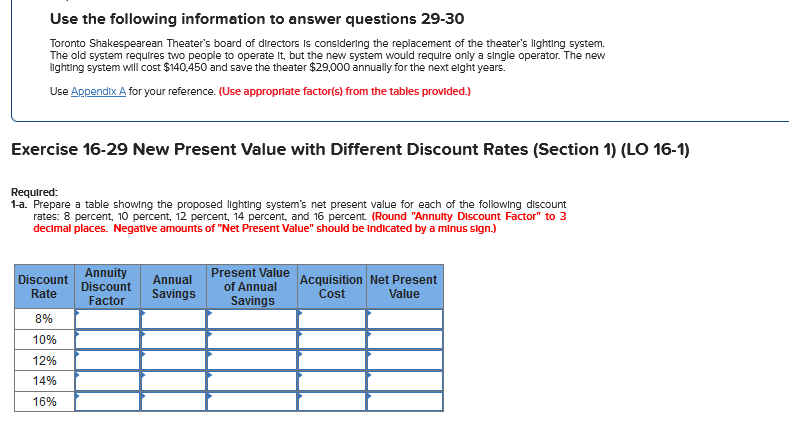
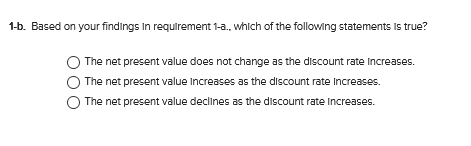
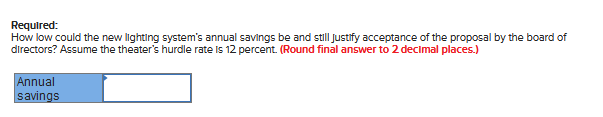
Use the following information to answer questions 29-30 Toronto Shakespearean Theater's board of directors is considering the replacement of the theater's lighting system. The old system requires two people to operate it, but the new system would require only a single operator. The new lighting system will cost $140.450 and save the theater $29,000 annually for the next elght years. Use Appendix A for your reference. (Use appropriate factor(s) from the tables provided.) Exercise 16-29 New Present Value with Different Discount Rates (Section 1) (LO 16-1) Required: 1-a. Prepare a table showing the proposed lighting system's net present value for each of the following discount rates: 8 percent, 10 percent, 12 percent, 14 percent, and 16 percent . (Round "Annuity Discount Factor" to 3 decimal places. Negative amounts of "Net Present Value" should be indicated by a minus sign.) Discount Rate Annuity Discount Factor Annual Savings Present Value of Annual Savings Acquisition Net Present Cost Value 8% 10% 12% 14% 16% 1-b. Based on your findings In requirement 1-a.. which of the following statements is true? The net present value does not change as the discount rate increases. The net present value Increases as the discount rate Increases. The net present value declines as the discount rate Increases. . Required: How low could the new lighting system's annual savings be and still justify acceptance of the proposal by the board of directors? Assume the theater's hurdle rate is 12 percent. (Round final answer to 2 decimal places.) Annual savings Future Value and Present Value Tables Table 1 Future Value of $1.00(1 + " 6% 8% 10% 12% 14% 20% Perlod 1 2 3 4% 1.040 1.082 1.125 1.170 1.217 1.060 1.124 1.140 1.300 1.120 1.254 1.405 1.574 1.762 1.191 1.263 1.338 4 1.482 1.689 1.925 5 1.080 1.166 1.260 1.361 1.469 1.587 1.714 1.851 1.999 2.159 1.200 1.440 1.728 2.074 2.488 2.986 3.583 4.300 5.160 6.192 6 7 8 9 1.100 1.210 1.331 1.464 1.611 1.772 1.949 2.144 2.359 2.594 2.853 3.139 3.452 3.798 4.177 1.266 1.316 1.369 1.423 1.480 1.540 1.601 1.665 1.732 1.801 1.419 1.504 1.594 1.690 1.791 1.898 2.012 2.133 2.261 2.397 10 1.974 2.211 2.476 2.773 3.106 3.479 3.896 2.195 2.502 2.853 3.252 3.707 4.226 4.818 5.492 6.261 7.138 11 12 13 14 15 2.332 2.518 2.720 2.937 3.172 4.661 10.063 21.725 4.364 4.887 5.474 7.430 8.916 10.699 12.839 15.407 38.338 237.380 1,469.800 20 30 40 2.191 3.243 4.801 3.207 5.744 10.286 6.728 17.450 45.260 9.646 29.960 93.051 13.743 50.950 188.880 Period 4% 6% 8% 10% 12% 14% 20% Table II Future Value of a Series of $1.00 Cash Flows (Ordinary Annuity) (1 + 1"-1 1 1.000 2.040 3.122 4.247 5.416 2 3 4 5 1.000 2.060 3.184 4.375 5.637 1.000 2.080 3.246 4.506 5.867 1.000 2.100 3.310 4.641 6.105 1.000 2.120 3.374 1.000 2.220 3.640 5.368 7.442 r 4.779 6.353 1.000 2.140 3.440 4.921 6.610 8.536 10.730 13.233 16.085 19.337 7.336 8.923 6 7 8 9 10 6.633 7.898 9.214 10.583 12.006 10.637 12.488 14.487 7.716 9.487 11.436 13.580 15.938 8.115 10.089 12.300 14.776 17.549 6.975 8.394 9.898 11.491 13.181 14.972 16.870 18.882 21.015 23.276 9.960 12.916 16.499 20.799 25.959 32.150 39.580 48.497 59.196 72.035 11 12 13 14 15 13.486 15.026 16.627 18.292 20.024 16.646 18.977 21.495 24.215 27.152 18.531 21.385 24.523 27.976 31.773 20.655 24.133 28.029 32.393 37.280 23.045 27.271 32.089 37.581 43.842 57.276 91.025 20 30 40 29.778 56.085 96.026 36.778 79.058 154.762 45.762 113.283 259.057 164.496 442.597 75.052 241.330 767.090 356.790 1,342.000 186.690 1,181.900 7,343.900 Table III Present Value of $1.00 1 (1 + )" Period 4% 6% 8% 10% 12% 14% 16% 18% 20% 22% 24% 26% 28% 30% 32% 1 .833 .893 .797 .926 .857 .794 2 3 .962 .925 .889 .855 .909 .826 .751 .694 .877 .769 .675 .592 .862 .743 .641 .552 .820 .672 .551 ,451 .806 .650 .524 423 .794 .630 .500 .397 .847 .718 .609 .516 437 .370 .314 .781 .610 .477 .373 .579 482 4 5 5 .476 .943 .890 .840 .792 .747 .705 .665 .627 .592 .558 .735 .681 .630 .583 .822 .790 .760 .731 .703 .676 .712 .636 .567 .507 ,452 ,404 .361 .322 .341 .275 .222 6 7 .519 .456 .400 .351 .308 .270 .683 .621 .564 .513 467 424 .386 .350 .319 .290 .263 .239 .402 .335 279 233 .194 .162 .370 303 .249 .204 .167 .137 .315 .250 .198 157 .769 .592 .455 .350 .269 .207 .159 .123 ,094 .073 .758 .574 ,435 .329 .250 .189 .143 .108 ,082 ,062 .291 .227 .178 .139 . 108 .085 410 .354 305 263 .227 8 9 10 .540 .500 .266 .225 .191 .179 .144 .116 .125 .463 .099 11 .650 .527 .429 .237 .135 .112 .094 .079 .066 .047 12 13 14 15 .625 .601 .577 .555 .497 ,469 442 ,417 .397 .368 .340 .315 .287 .257 .229 .205 .183 208 .182 .160 .140 .195 .168 .145 .125 . 108 .051 .162 .137 .116 .099 .084 .037 .007 .001 .112 .093 .078 .066 .026 .092 .075 .062 .051 .076 .061 .049 .040 .062 .050 .039 ,031 .052 .040 .032 .025 ,056 .043 ,033 .025 .020 .036 .027 .021 .016 ,456 215 .073 .019 .010 .007 ,005 .004 20 30 40 .312 174 .097 .149 .067 .014 .002 .104 .033 .011 .003 308 .208 .001 .001 .099 .046 .020 .005 .012 .003 .004 .001 .022 - Table IV Present Value of Series of $1.00 Cash Flows 1 (1 + m) / (i-dl Period 4% 6% 8% 14% 16% 18% 20% 22% 24% 25% 26% 28% 30% 1 0.794 1.424 2 3 4 5 0.962 1.886 2.775 3.630 4.452 0.833 1.528 2.106 2.589 0.862 1.605 2.246 2.798 3.274 10% 12% 0.909 0.896 1.736 1.690 2.487 2.402 3.170 3.037 3.791 3.606 4.355 4.111 4.868 4.564 5.335 4.968 5.759 5.328 6.145 5.650 0.877 1.647 2.322 2.914 3.433 3.889 4.288 4.639 0.943 1.833 2.673 3.465 4.212 4.917 5.582 6.210 6.802 7.360 0.847 1.566 2.174 2.690 3.127 3.498 3.812 4.078 0.781 1.392 1.868 2.241 2.532 0.800 1.440 1.952 2.362 2.689 2.951 3.161 3.329 0.769 1.361 1.816 2.166 2.436 2.991 1.923 2.320 2.635 2.885 3.083 3.241 6 7 5.242 6.002 6.733 3.685 4.039 4.344 4.607 3.326 3,605 3.837 0.820 1.492 2.042 2.494 2.864 3.167 3.416 3.619 3.786 3.923 4.035 4.127 4.203 4.265 4.315 8 0.926 1.783 2.577 3.312 3.993 4.623 5.206 5.747 6.247 6.710 7.139 7.536 7.904 8.244 8.559 9.818 11.258 11.925 9 2.759 2.937 3.076 3.184 3.269 7.435 8.111 3.463 3.571 0.806 1.457 1.981 2.404 2.745 3.020 3.242 3.421 3.566 3.682 3.776 3.851 3.912 3.962 4.001 4.110 4.160 4.166 4.946 5.216 5.453 5.660 4.833 5.938 10 11 12 13 14 15 3.656 3.725 2.643 2.802 2.925 3.019 3.092 3.147 3.190 3.223 3.249 3.268 8.760 9.385 9.986 10.563 7.887 8.384 8.853 9.295 4.303 4.494 4.656 4.793 4.910 5.008 5.092 6.496 6.814 7.103 7.367 7.606 8.514 9.427 9.779 3.335 3.387 3.427 6.194 6.424 6.628 6.811 4.031 4.192 4.327 4.439 4.533 4.611 4.675 4.870 4.979 4.997 5.029 5.197 5.342 5.468 5.575 5.929 6.177 6.234 3.780 3.824 3.859 3.366 3.465 3.544 3.606 3.656 3.696 3.726 3.808 3.842 3.846 5.842 6.002 6.142 6.623 7.003 7.105 9.712 11.118 13.590 17.292 19.793 20 30 3.316 11.470 13.765 15.046 7.469 8.055 8.244 5.353 5.517 5.548 4.460 4.534 4.544 3.459 3.483 3.546 3.569 3.571 3.964 3.995 3.999 3.332 3.333 40