See screenshot
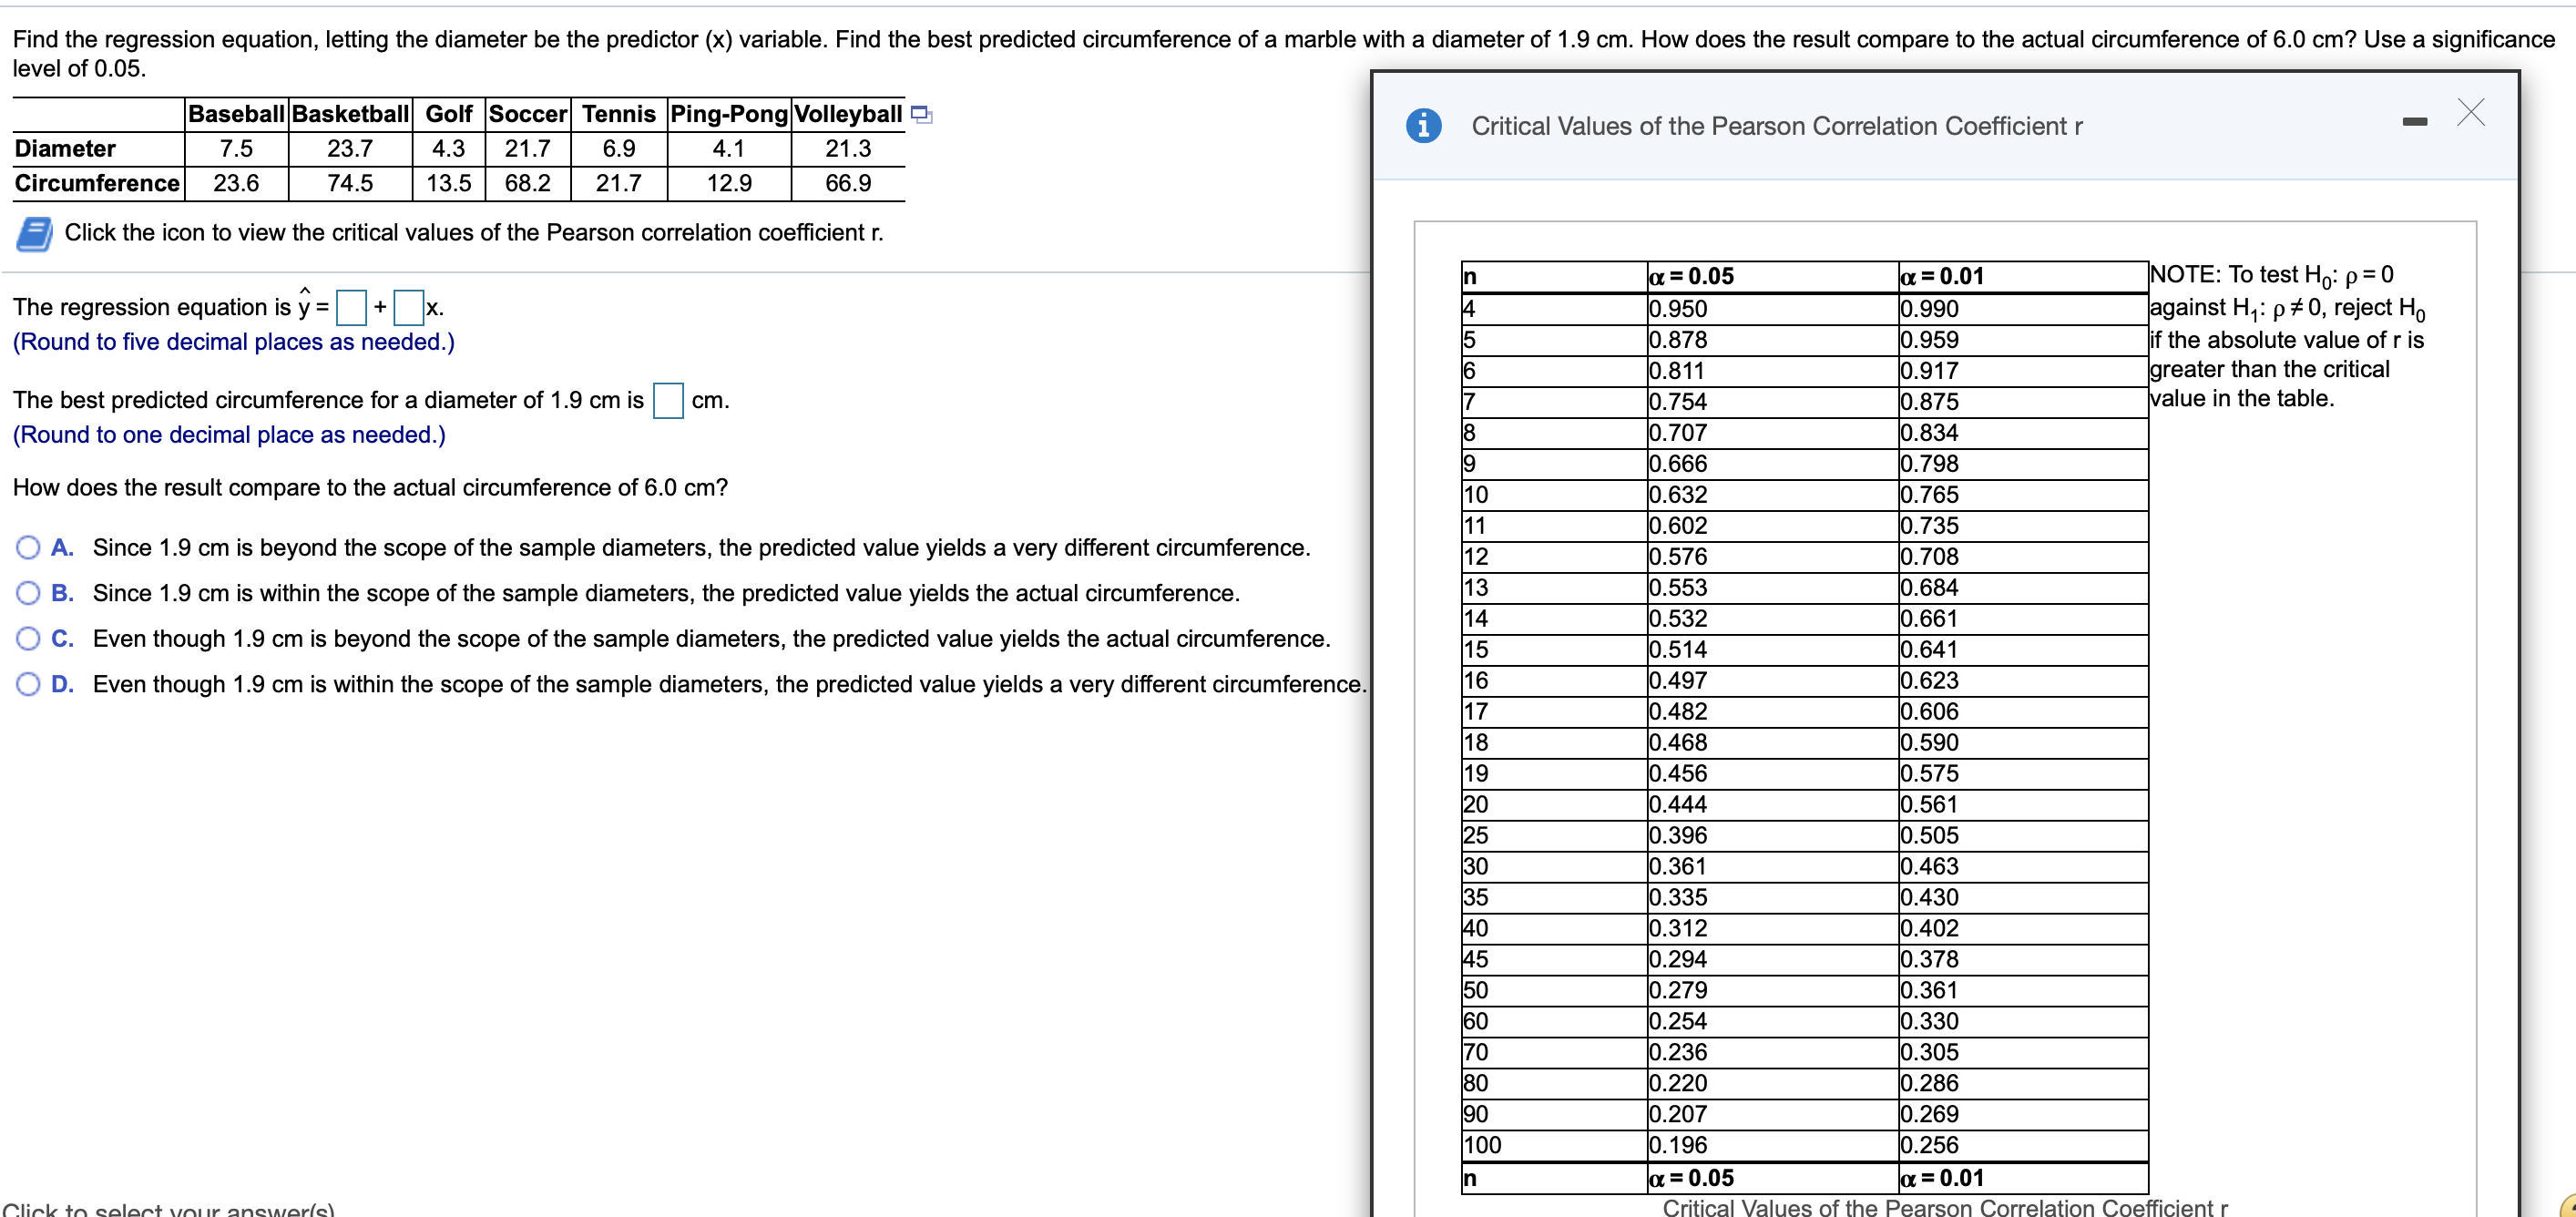
Find the regression equation, letting the diameter be the predictor (x) variable. Find the best predicted circumference of a marble with a diameter of 1.9 cm. How does the result compare to the actual circumference of 6.0 cm? Use a significance level of 0.05. Baseball Basketball Golf Soccer Tennis Ping-Pong Volleyball Diameter 7.5 23.7 4.3 21.7 6.9 4.1 21.3 i Critical Values of the Pearson Correlation Coefficient r X Circumference 23.6 74.5 13.5 68.2 21.7 12.9 66.9 Click the icon to view the critical values of the Pearson correlation coefficient r. The regression equation is y = ] + x. a = 0.05 a = 0.01 NOTE: To test Ho: p = 0 0.950 0.990 against H1: p #0, reject Ho (Round to five decimal places as needed.) 0.878 0.959 if the absolute value of r is 0.811 The best predicted circumference for a diameter of 1.9 cm is cm. 0.917 greater than the critical 0.754 0.875 value in the table. (Round to one decimal place as needed.) 8 0.707 0.834 9 0.666 How does the result compare to the actual circumference of 6.0 cm? 0.798 10 0.632 0.765 11 0.602 A. Since 1.9 cm is beyond the scope of the sample diameters, the predicted value yields a very different circumference. 0.735 12 0.576 0.708 O B. Since 1.9 cm is within the scope of the sample diameters, the predicted value yields the actual circumference. 13 0.553 0.68 O C. Even though 1.9 cm is beyond the scope of the sample diameters, the predicted value yields the actual circumference. 14 0.532 0.661 15 0.514 0.641 O D. Even though 1.9 cm is within the scope of the sample diameters, the predicted value yields a very different circumference. 16 0.497 0.623 17 0.482 0.606 18 0.468 0.590 19 0.456 0.575 20 0.444 0.561 25 0.396 0.505 30 .361 0.463 35 0.335 0.430 40 0.312 0.402 45 0.294 0.378 50 0.279 0.361 60 0.254 0.330 70 0.236 0.305 80 0.220 0.286 90 0.207 0.269 100 0. 196 0.256 In a = 0.05 a = 0.01