Answered step by step
Verified Expert Solution
Link Copied!

Question

1 Approved Answer

See screenshot Use the given data to nd the equation of the regression line. Examine the scatterplot and identify a characteristic of the data that

See screenshot
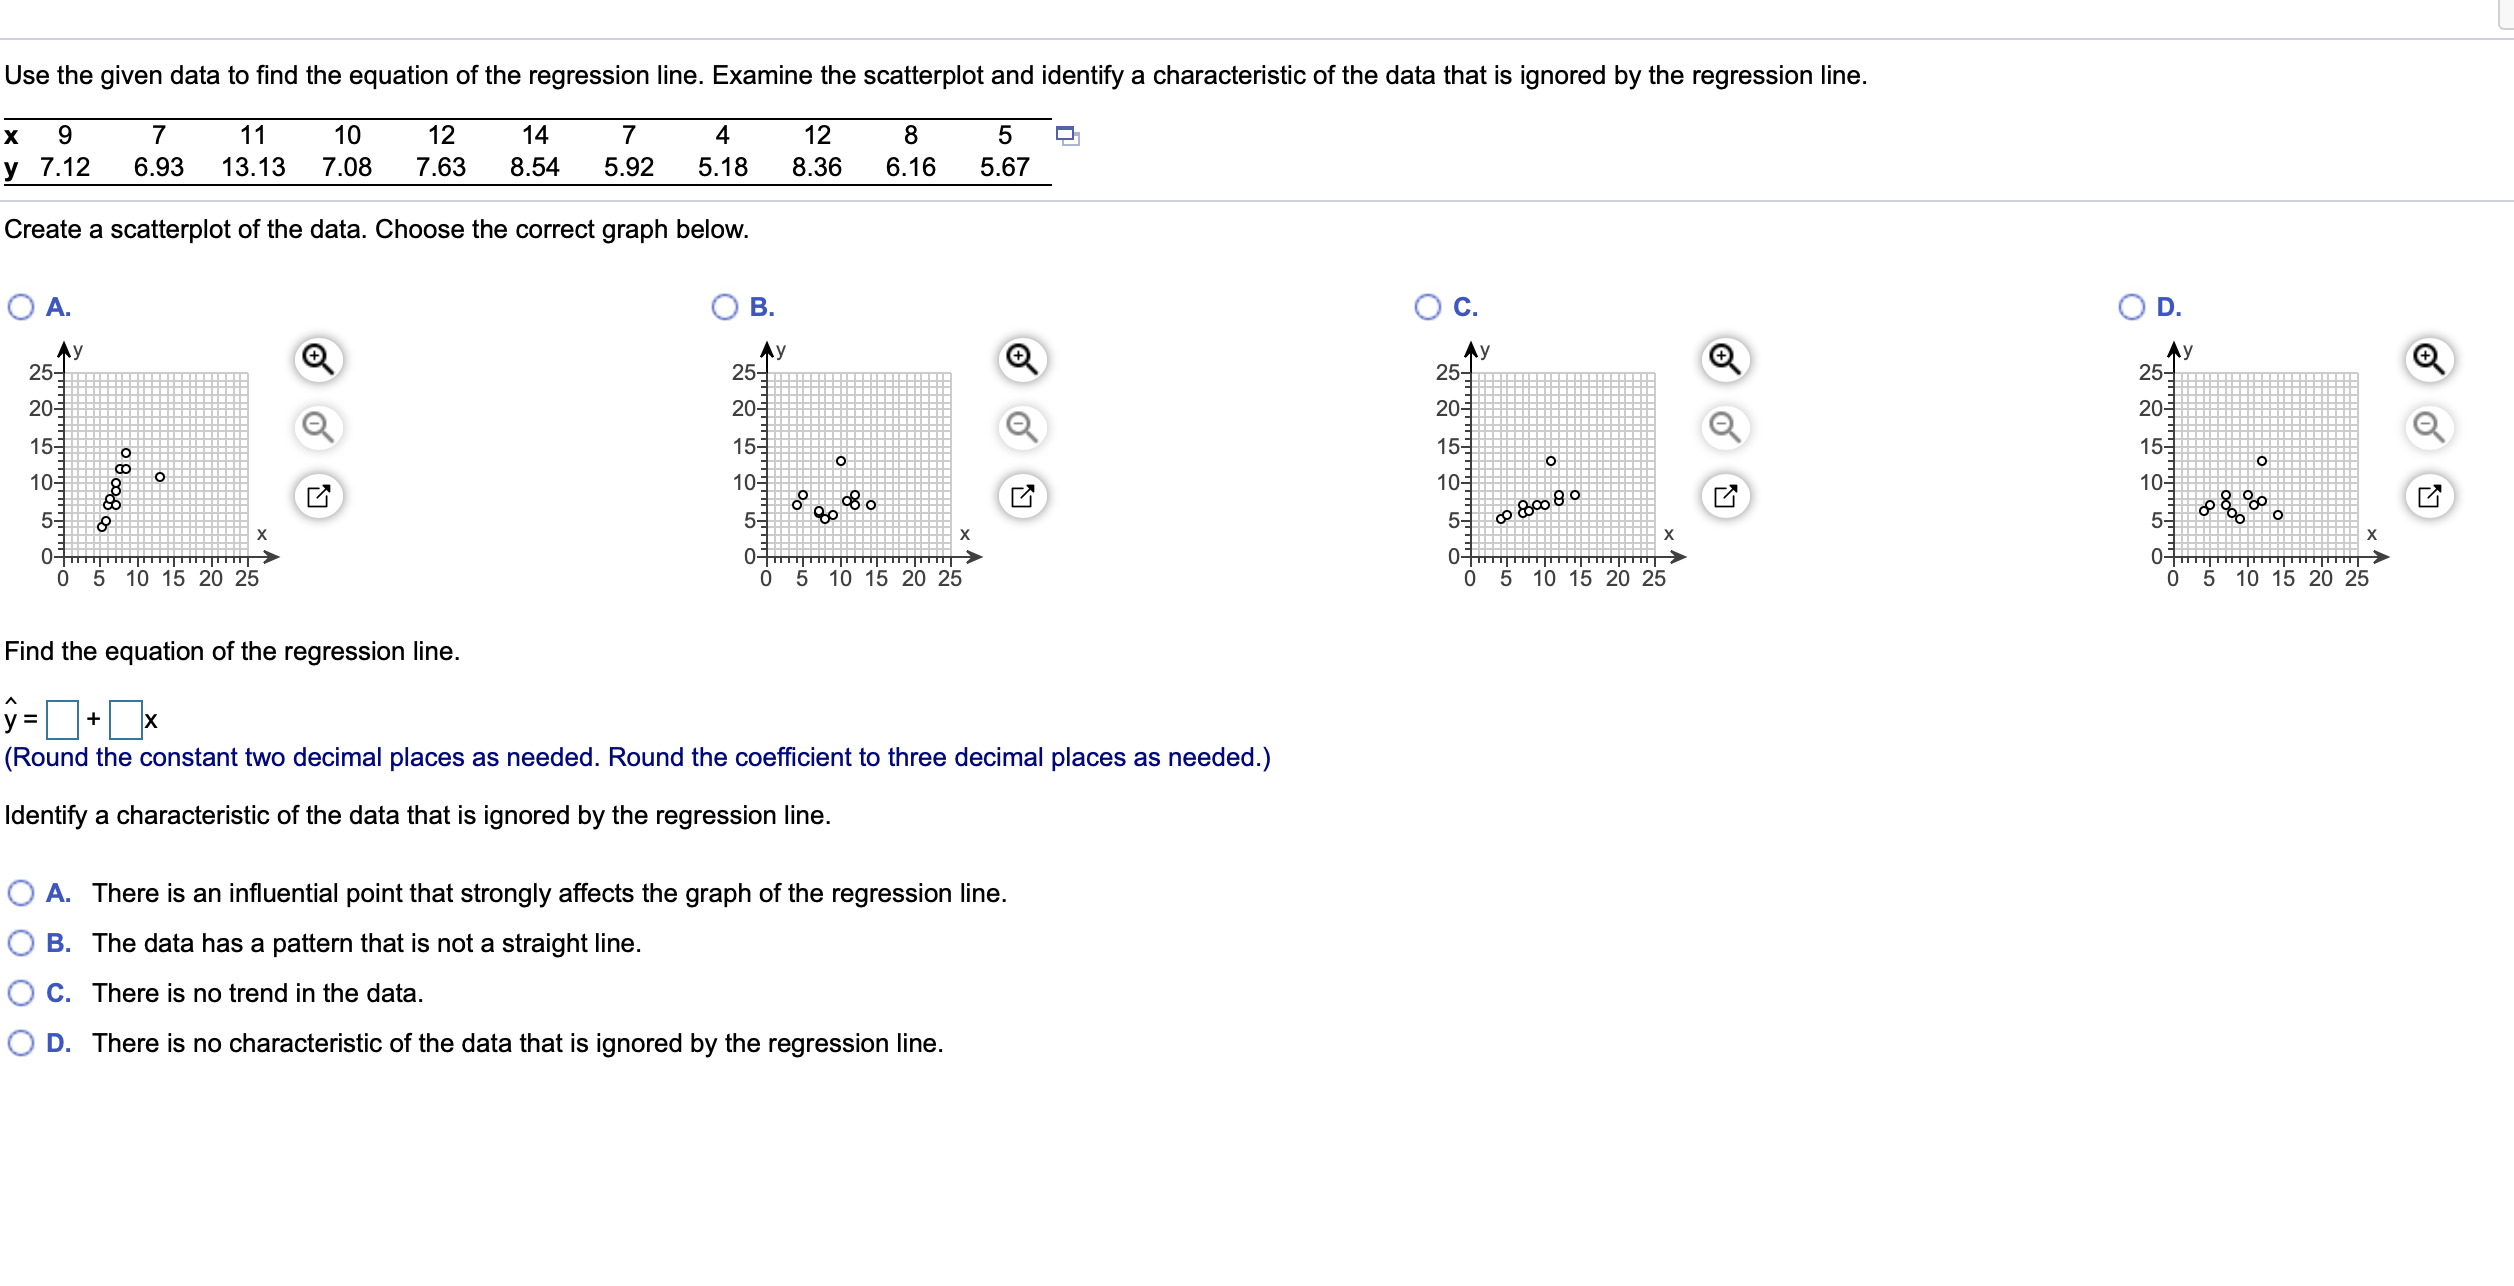
image text in transcribed
Use the given data to nd the equation of the regression line. Examine the scatterplot and identify a characteristic of the data that is ignored by the regression line. x 9 7 11 10 12 14 7 4 12 8 5 E: y 7.12 6.93 13.13 7.08 7.63 8.54 5.92 5.18 8.36 6.16 5.67 Create a scatterplot of the data. Choose the correct graph below. O A. O B. O C. V V Y 2. @ 2. @ 2. @ 20 Q 20 Q 20 Q 15 15 15 w @ 1 @ 1 @ 5 5 5 X X X 0 0 0 0 5 1015 20 25 0 5 1015 20 25 0 5 1015 20 25 Find the equation of the regression line. = |+ x (Round the constant two decimal places as needed. Round the coefcient to three decimal places as needed.) Identify a characteristic of the data that is ignored by the regression line. 0 A. There is an inuential point that strongly affects the graph of the regression line. 0 B. The data has a pattern that is not a straight line. 0 c. There is no trend in the data. 0 D. There is no characteristic of the data that is ignored by the regression line. OD. 25 20 15 10 5 0 0 510152025

Step by Step Solution

There are 3 Steps involved in it

Step: 1

blur-text-image

Get Instant Access to Expert-Tailored Solutions

See step-by-step solutions with expert insights and AI powered tools for academic success

Step: 2

blur-text-image

Step: 3

blur-text-image

Ace Your Homework with AI

Get the answers you need in no time with our AI-driven, step-by-step assistance

Get Started

Recommended Textbook for

Algebra And Trigonometry

Authors: Cynthia Y Young

3rd Edition

1118475755, 9781118475751

More Books

Students also viewed these Mathematics questions