

Answered step by step
Verified Expert Solution
Question
1 Approved Answer
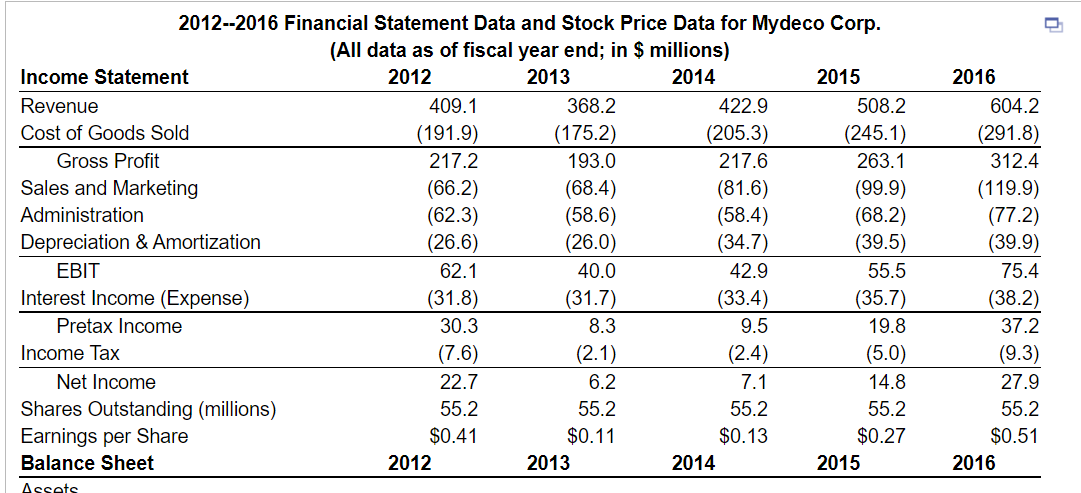
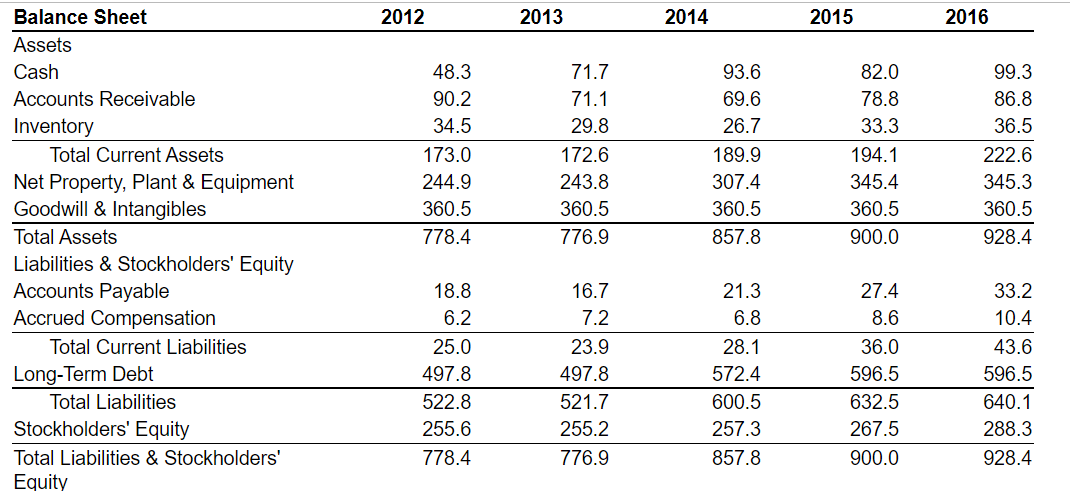
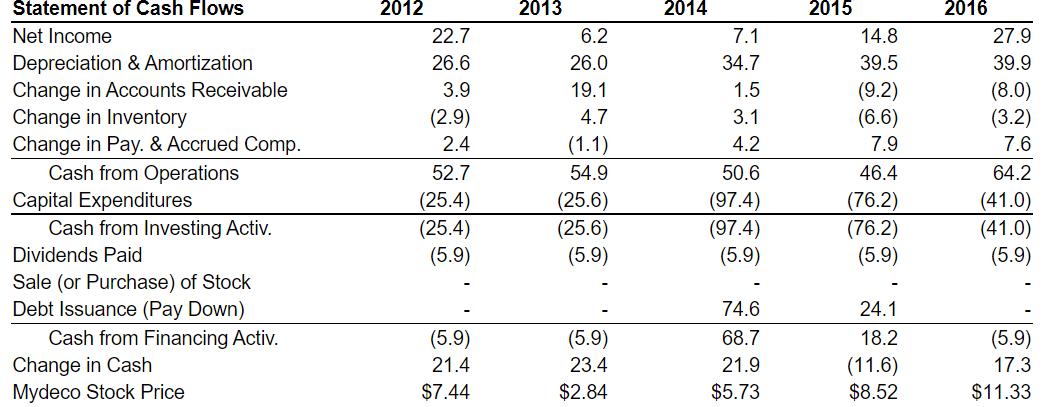
See Table 2.5 showing financial statement data and stock price data for Mydeco Corp. a. By what percentage did Mydeco's revenues grow each year from
Step by Step Solution
There are 3 Steps involved in it
Step: 1

Get Instant Access to Expert-Tailored Solutions
See step-by-step solutions with expert insights and AI powered tools for academic success
Step: 2

Step: 3
Ace Your Homework with AI
Get the answers you need in no time with our AI-driven, step-by-step assistance
Get Started
The Complete FinOps Handbook Essential Tools And Techniques For Financial Operations
Authors: Peter Bates
1st Edition
1922435546, 978-1922435545